Read every risk.See every opportunity.
The unified risk operating system for the modern institutional investor.
The whole book,seen on one dial.
Allocation, risk, performance, market intelligence and reporting, unified. One set of numbers you can trust.
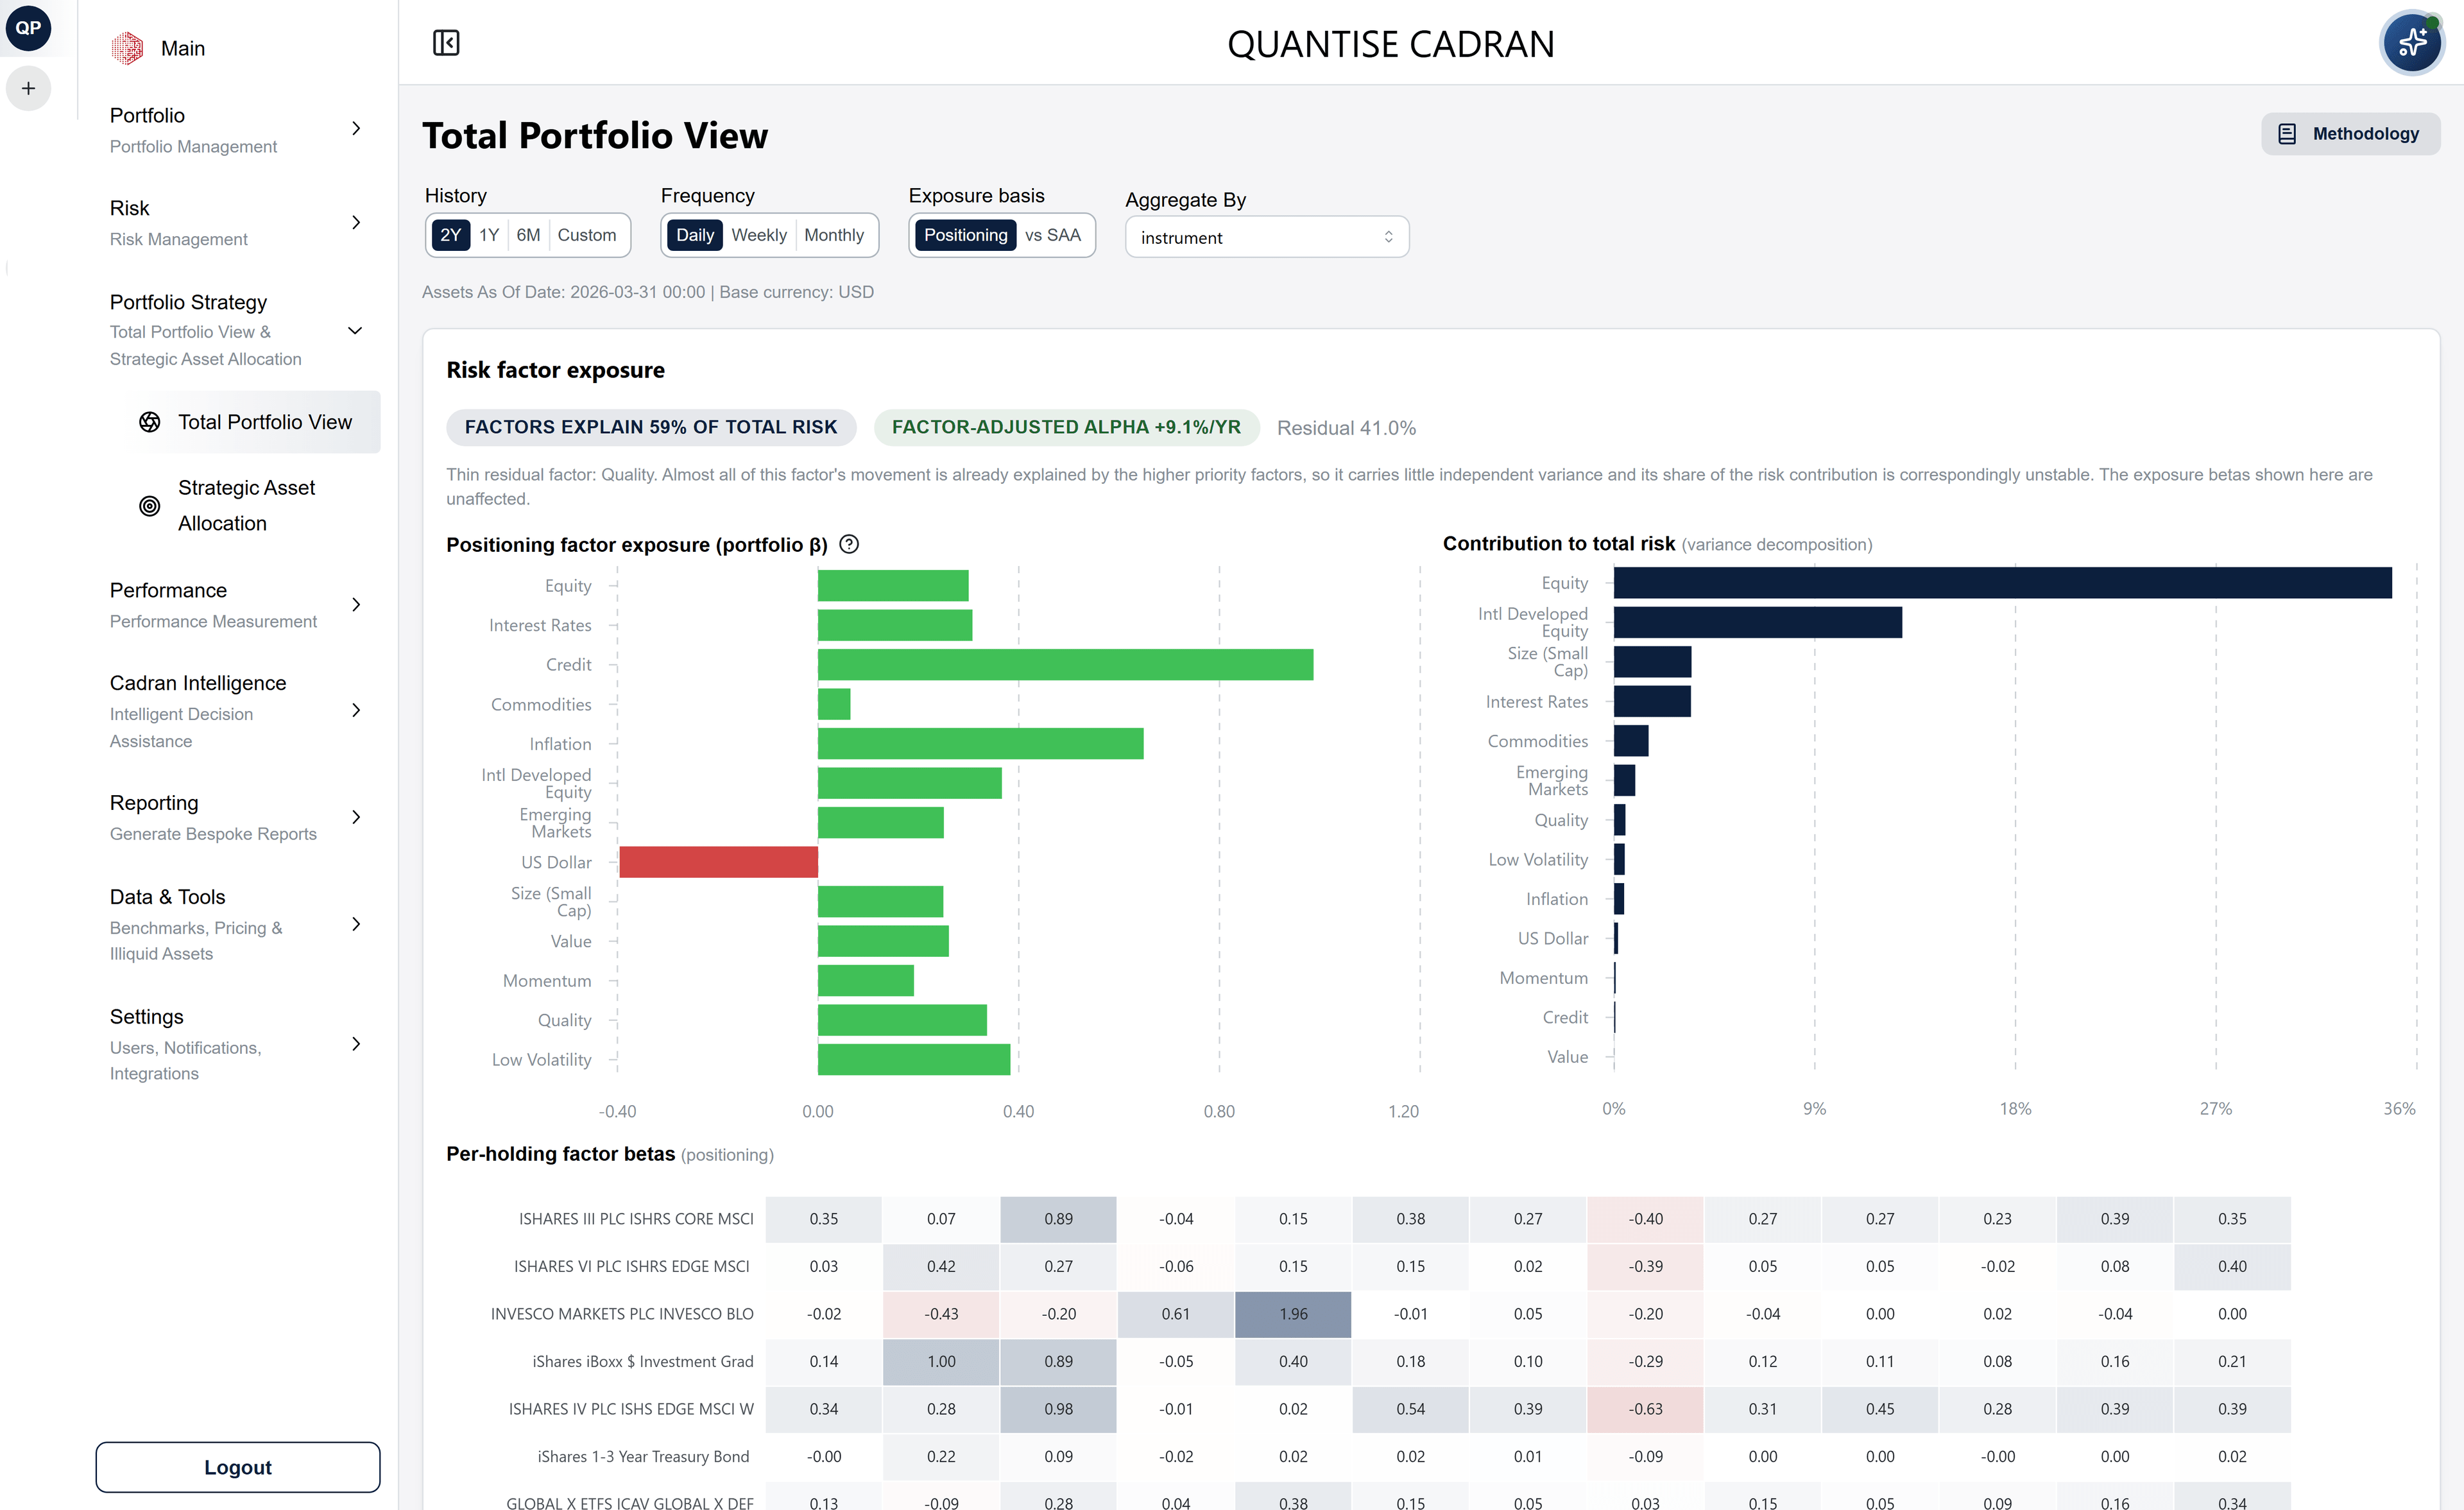
Total Portfolio View
Look through asset-class silos to the risk and return of the whole book at once. A portfolio can look well diversified by asset class yet hold most of its risk in a handful of drivers. Cadran shows what truly drives it, live, and complements SAA and TAA rather than replacing them.
- Factor model built from liquid market proxies
- Each unit of risk counted once, never twice
- Exposure read as positioning, or as a tilt against policy
- Residual reported as idiosyncratic risk
- Contribution to total risk, per holding
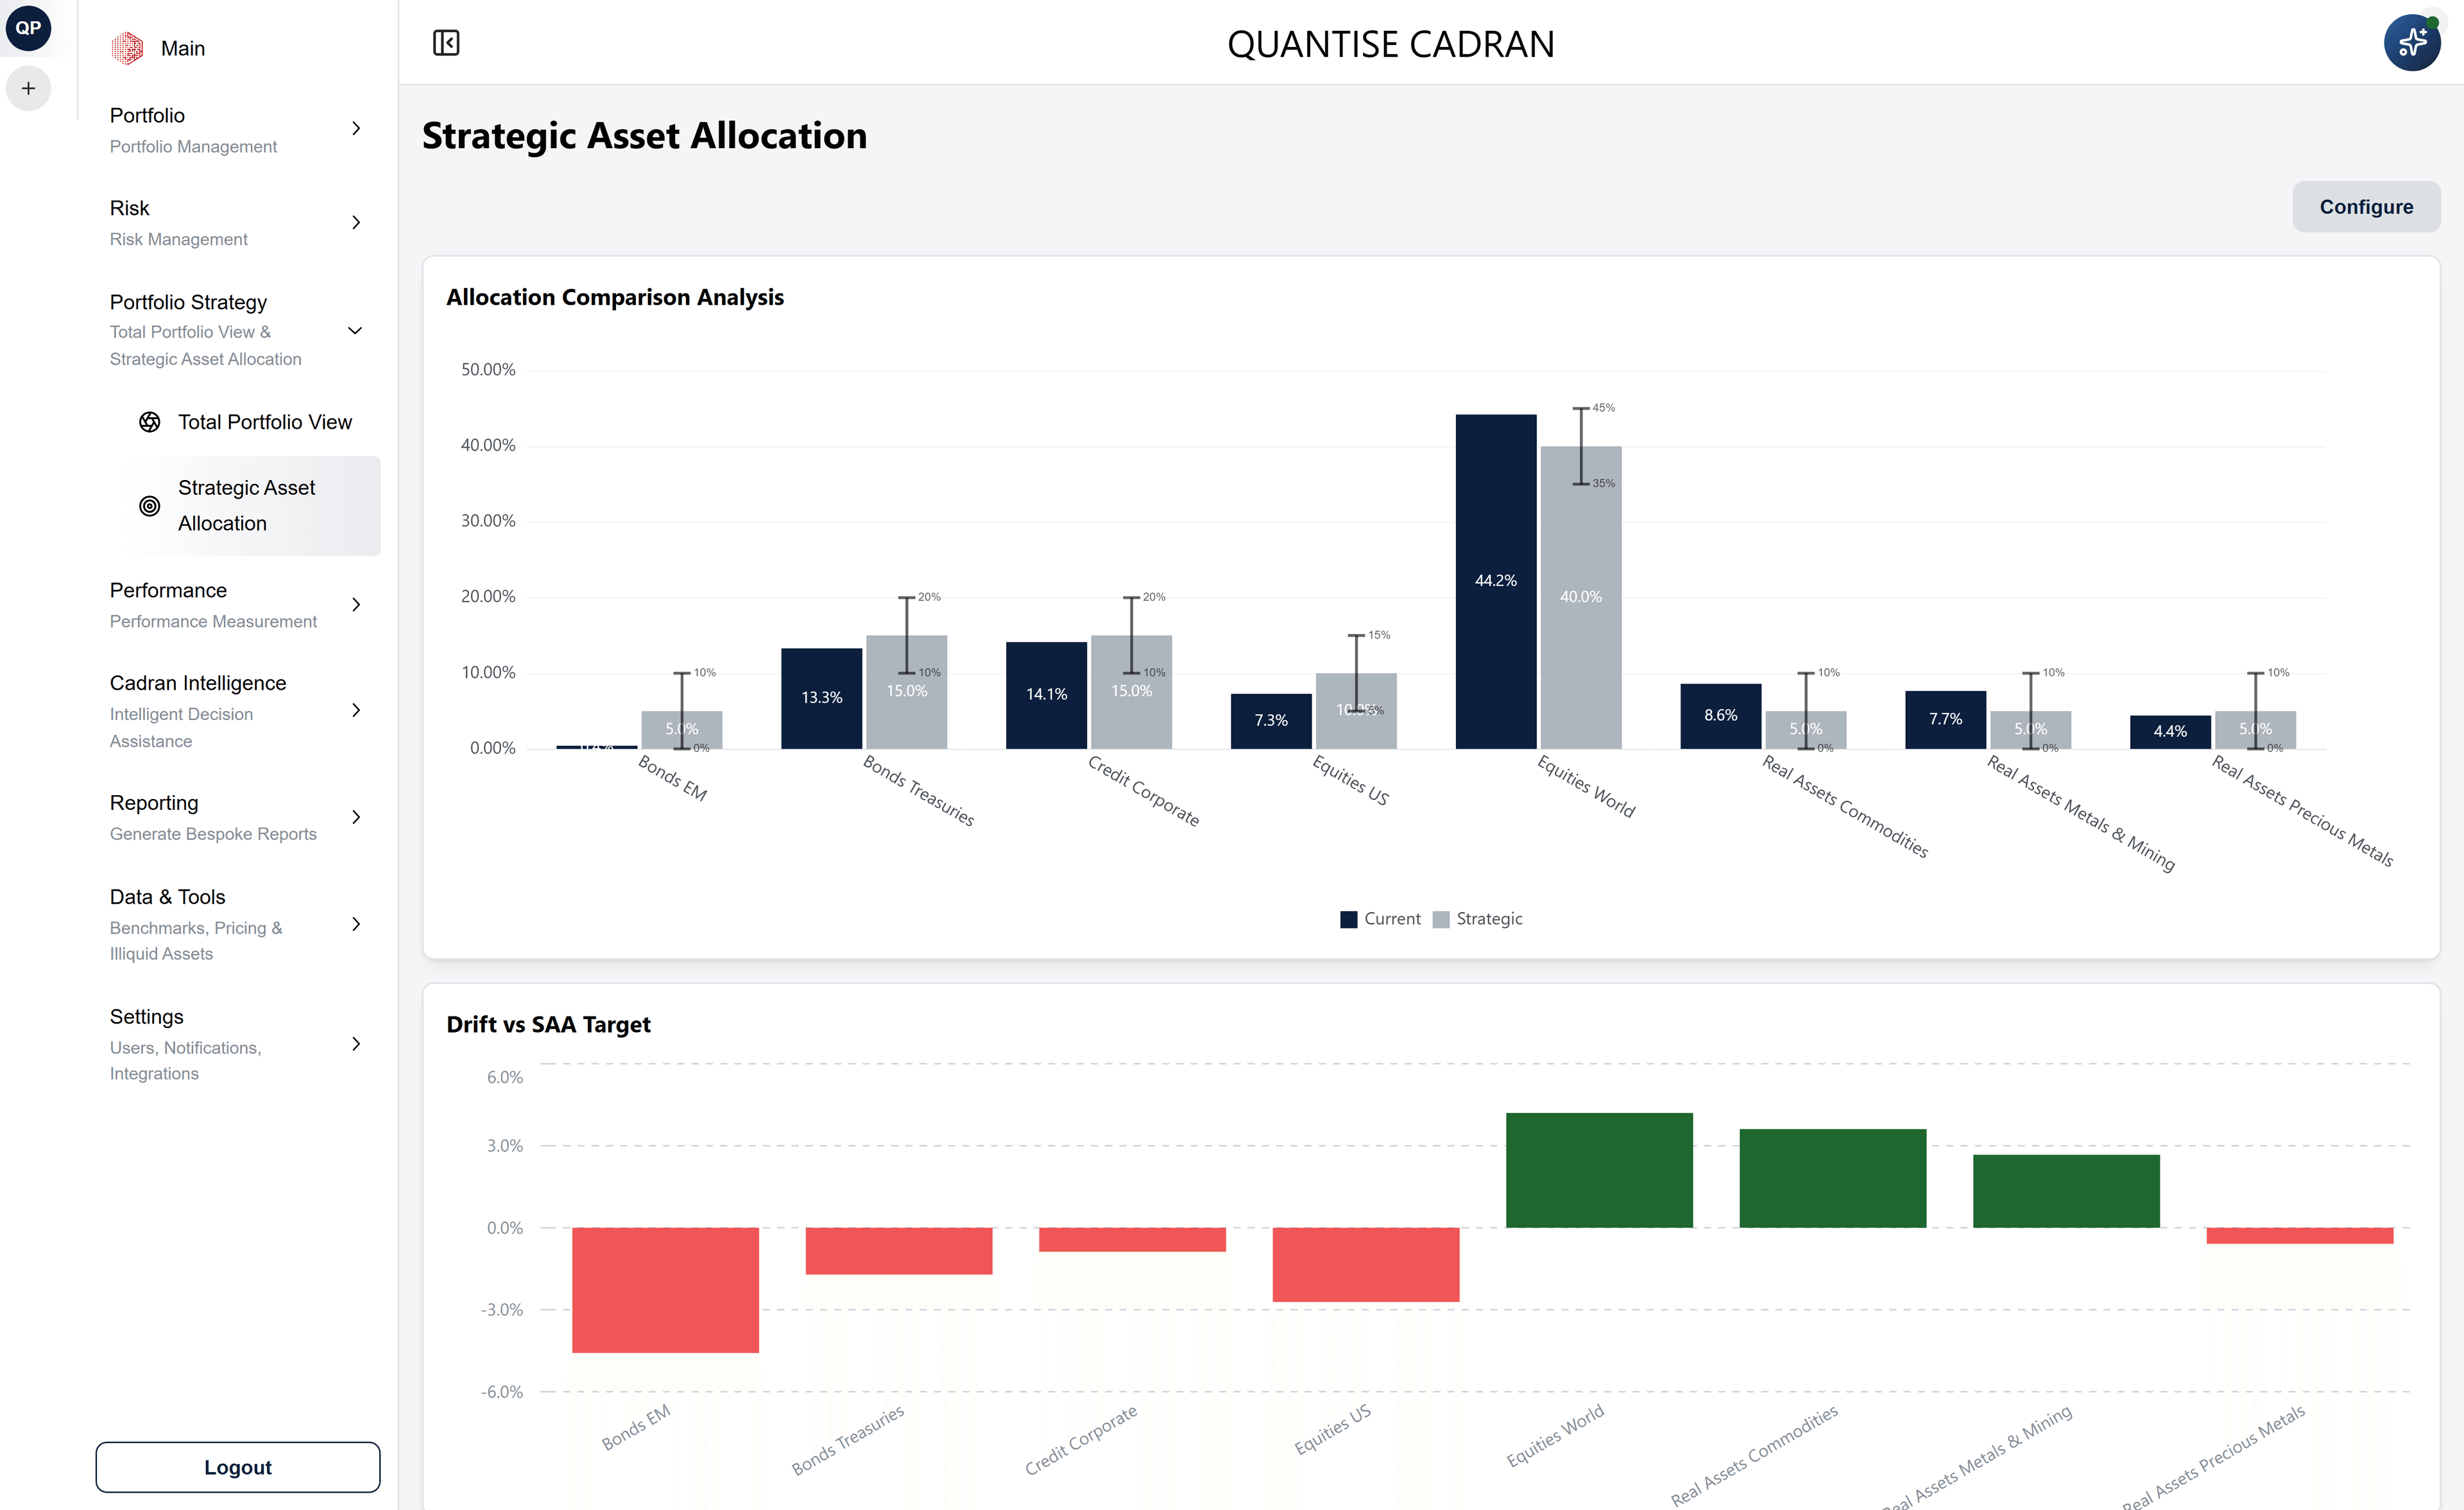
Strategic Asset Allocation
The SAA remains the anchor of the whole process. Compare the current allocation against strategic targets, watch drift as it develops and keep every decision measured against the long-term strategy.
- Current versus strategic allocation
- Drift versus SAA target, by asset class
- Multi-asset class support
- Benchmark comparison
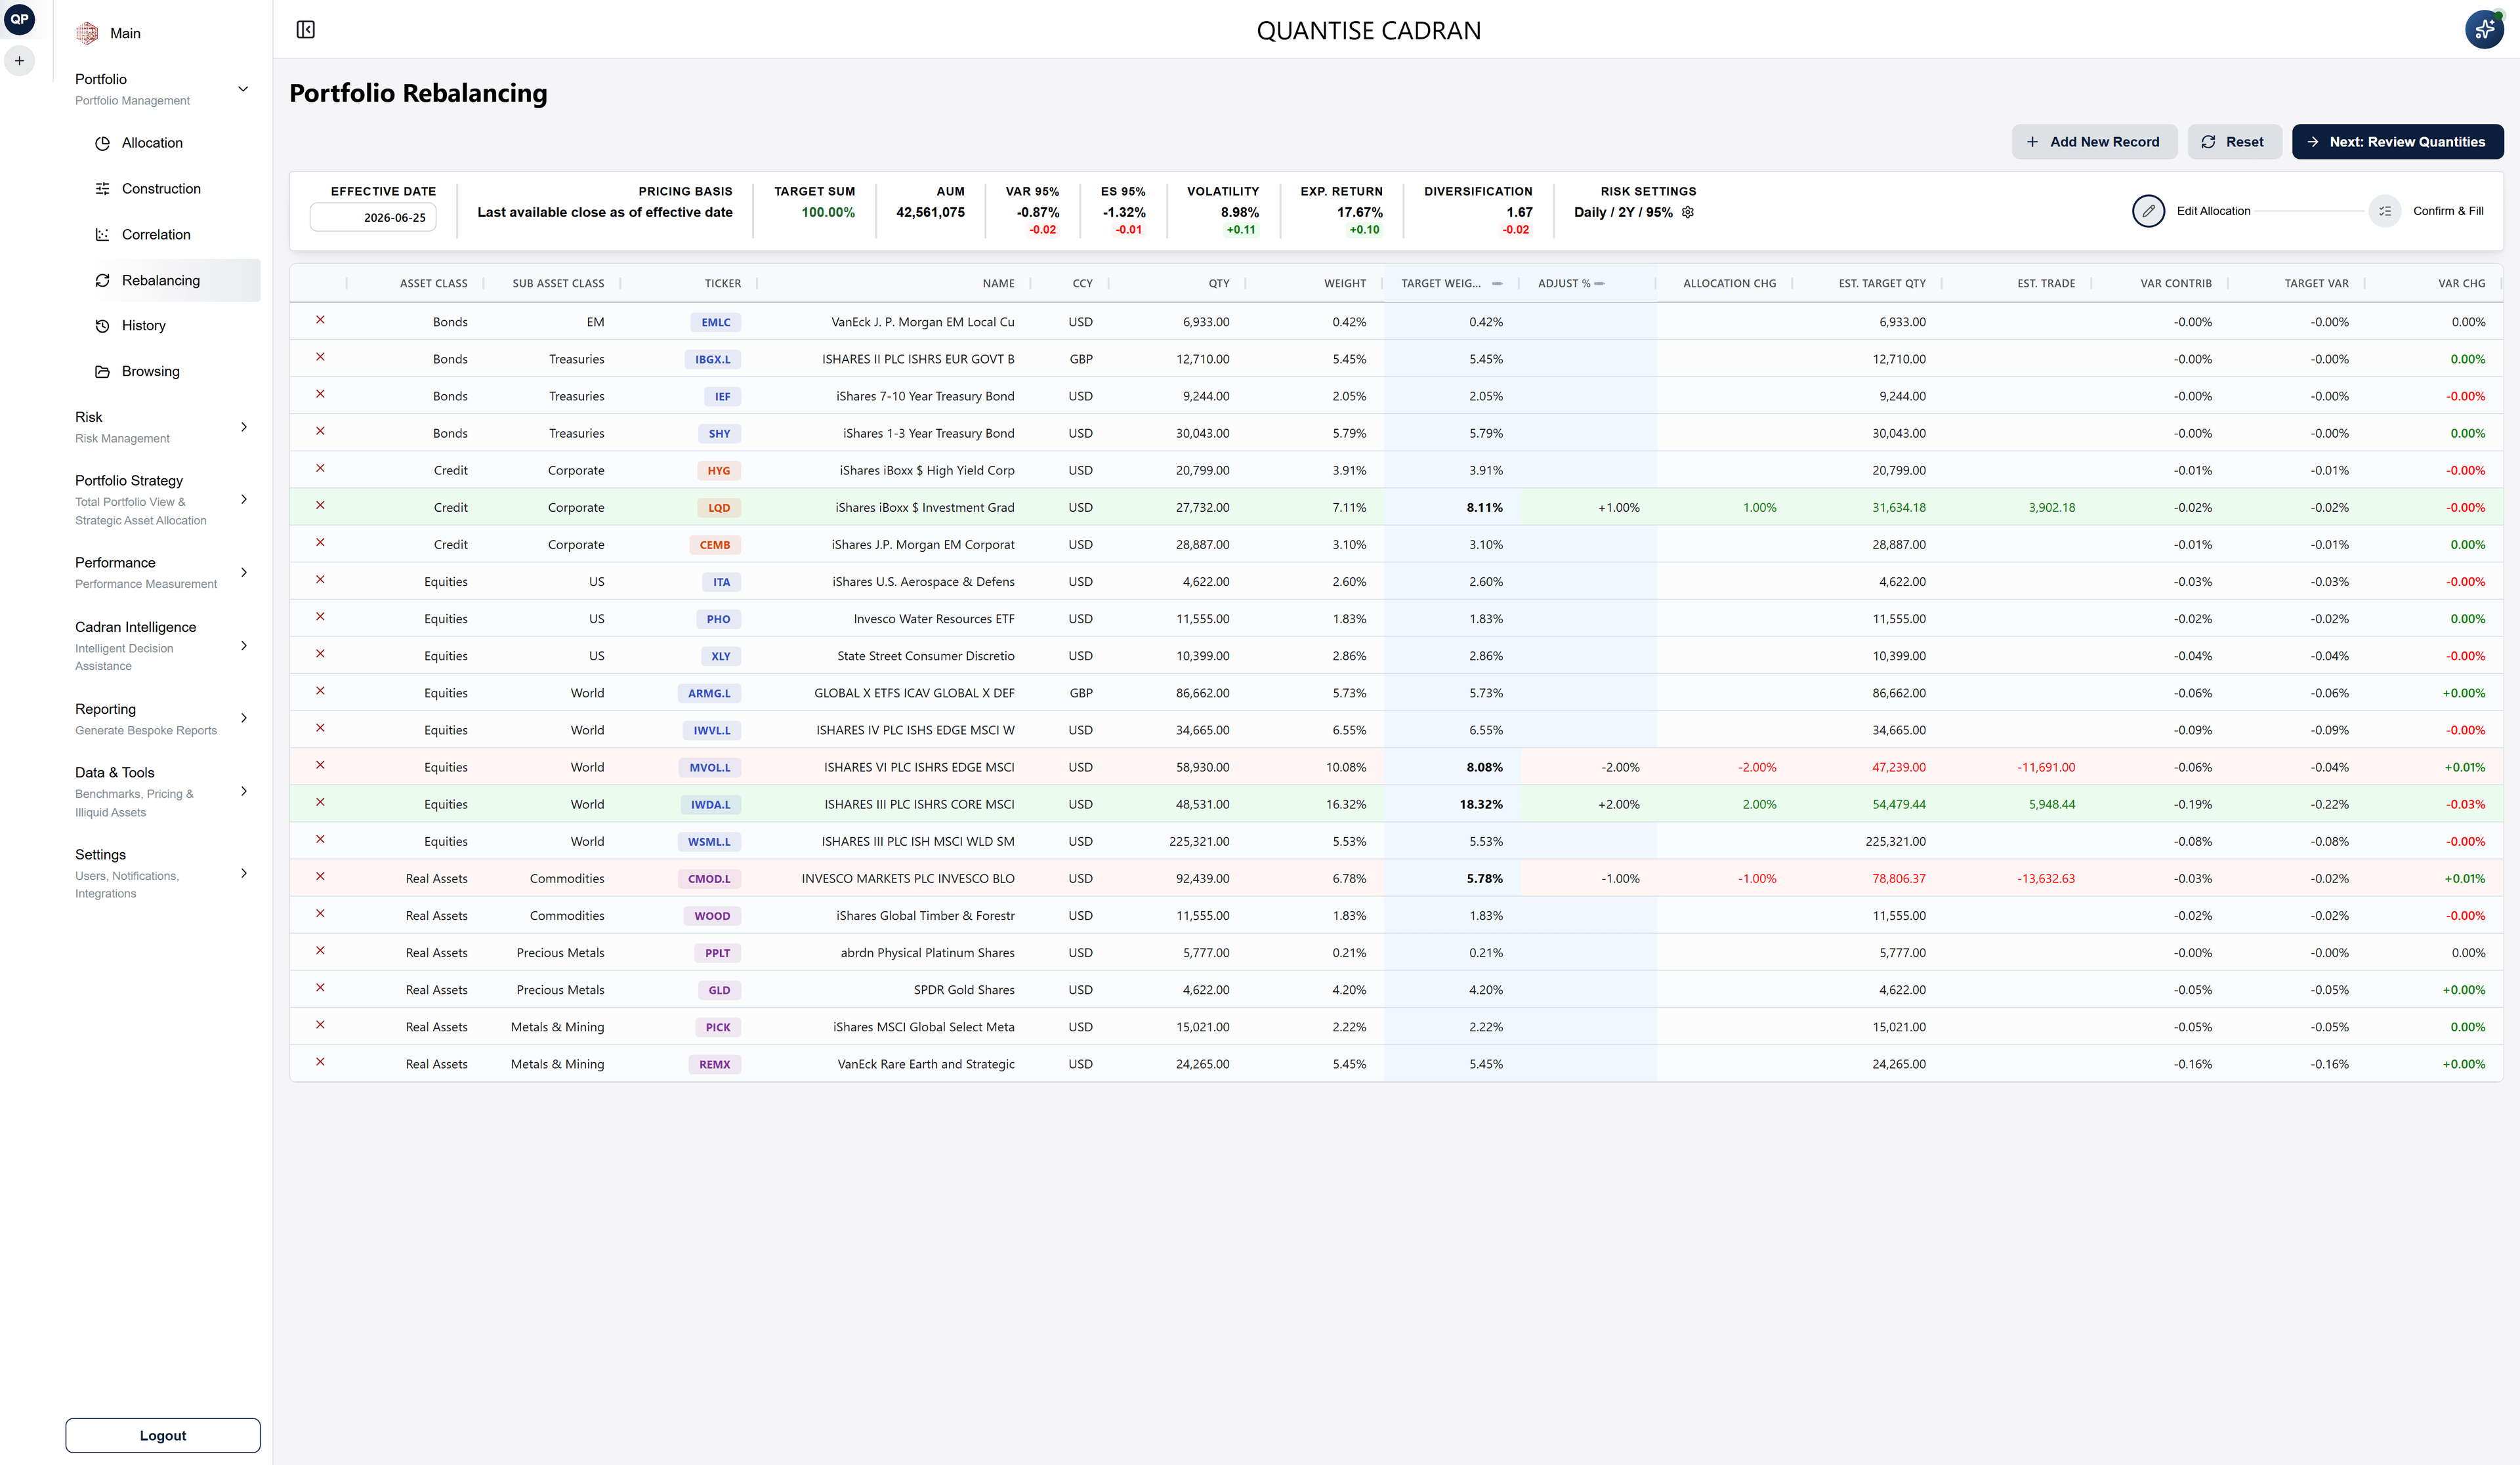
Allocation & Rebalancing
See allocation and exposure at a glance with treemaps, currency and geographic maps and a top-holdings breakdown. Then rebalance through a two-step draft and confirm flow, with live risk impact and drift versus strategic targets.
- Treemaps, currency & geographic exposure
- Top-holdings breakdown
- Two-step draft / confirm rebalancing
- Live risk impact and drift versus SAA
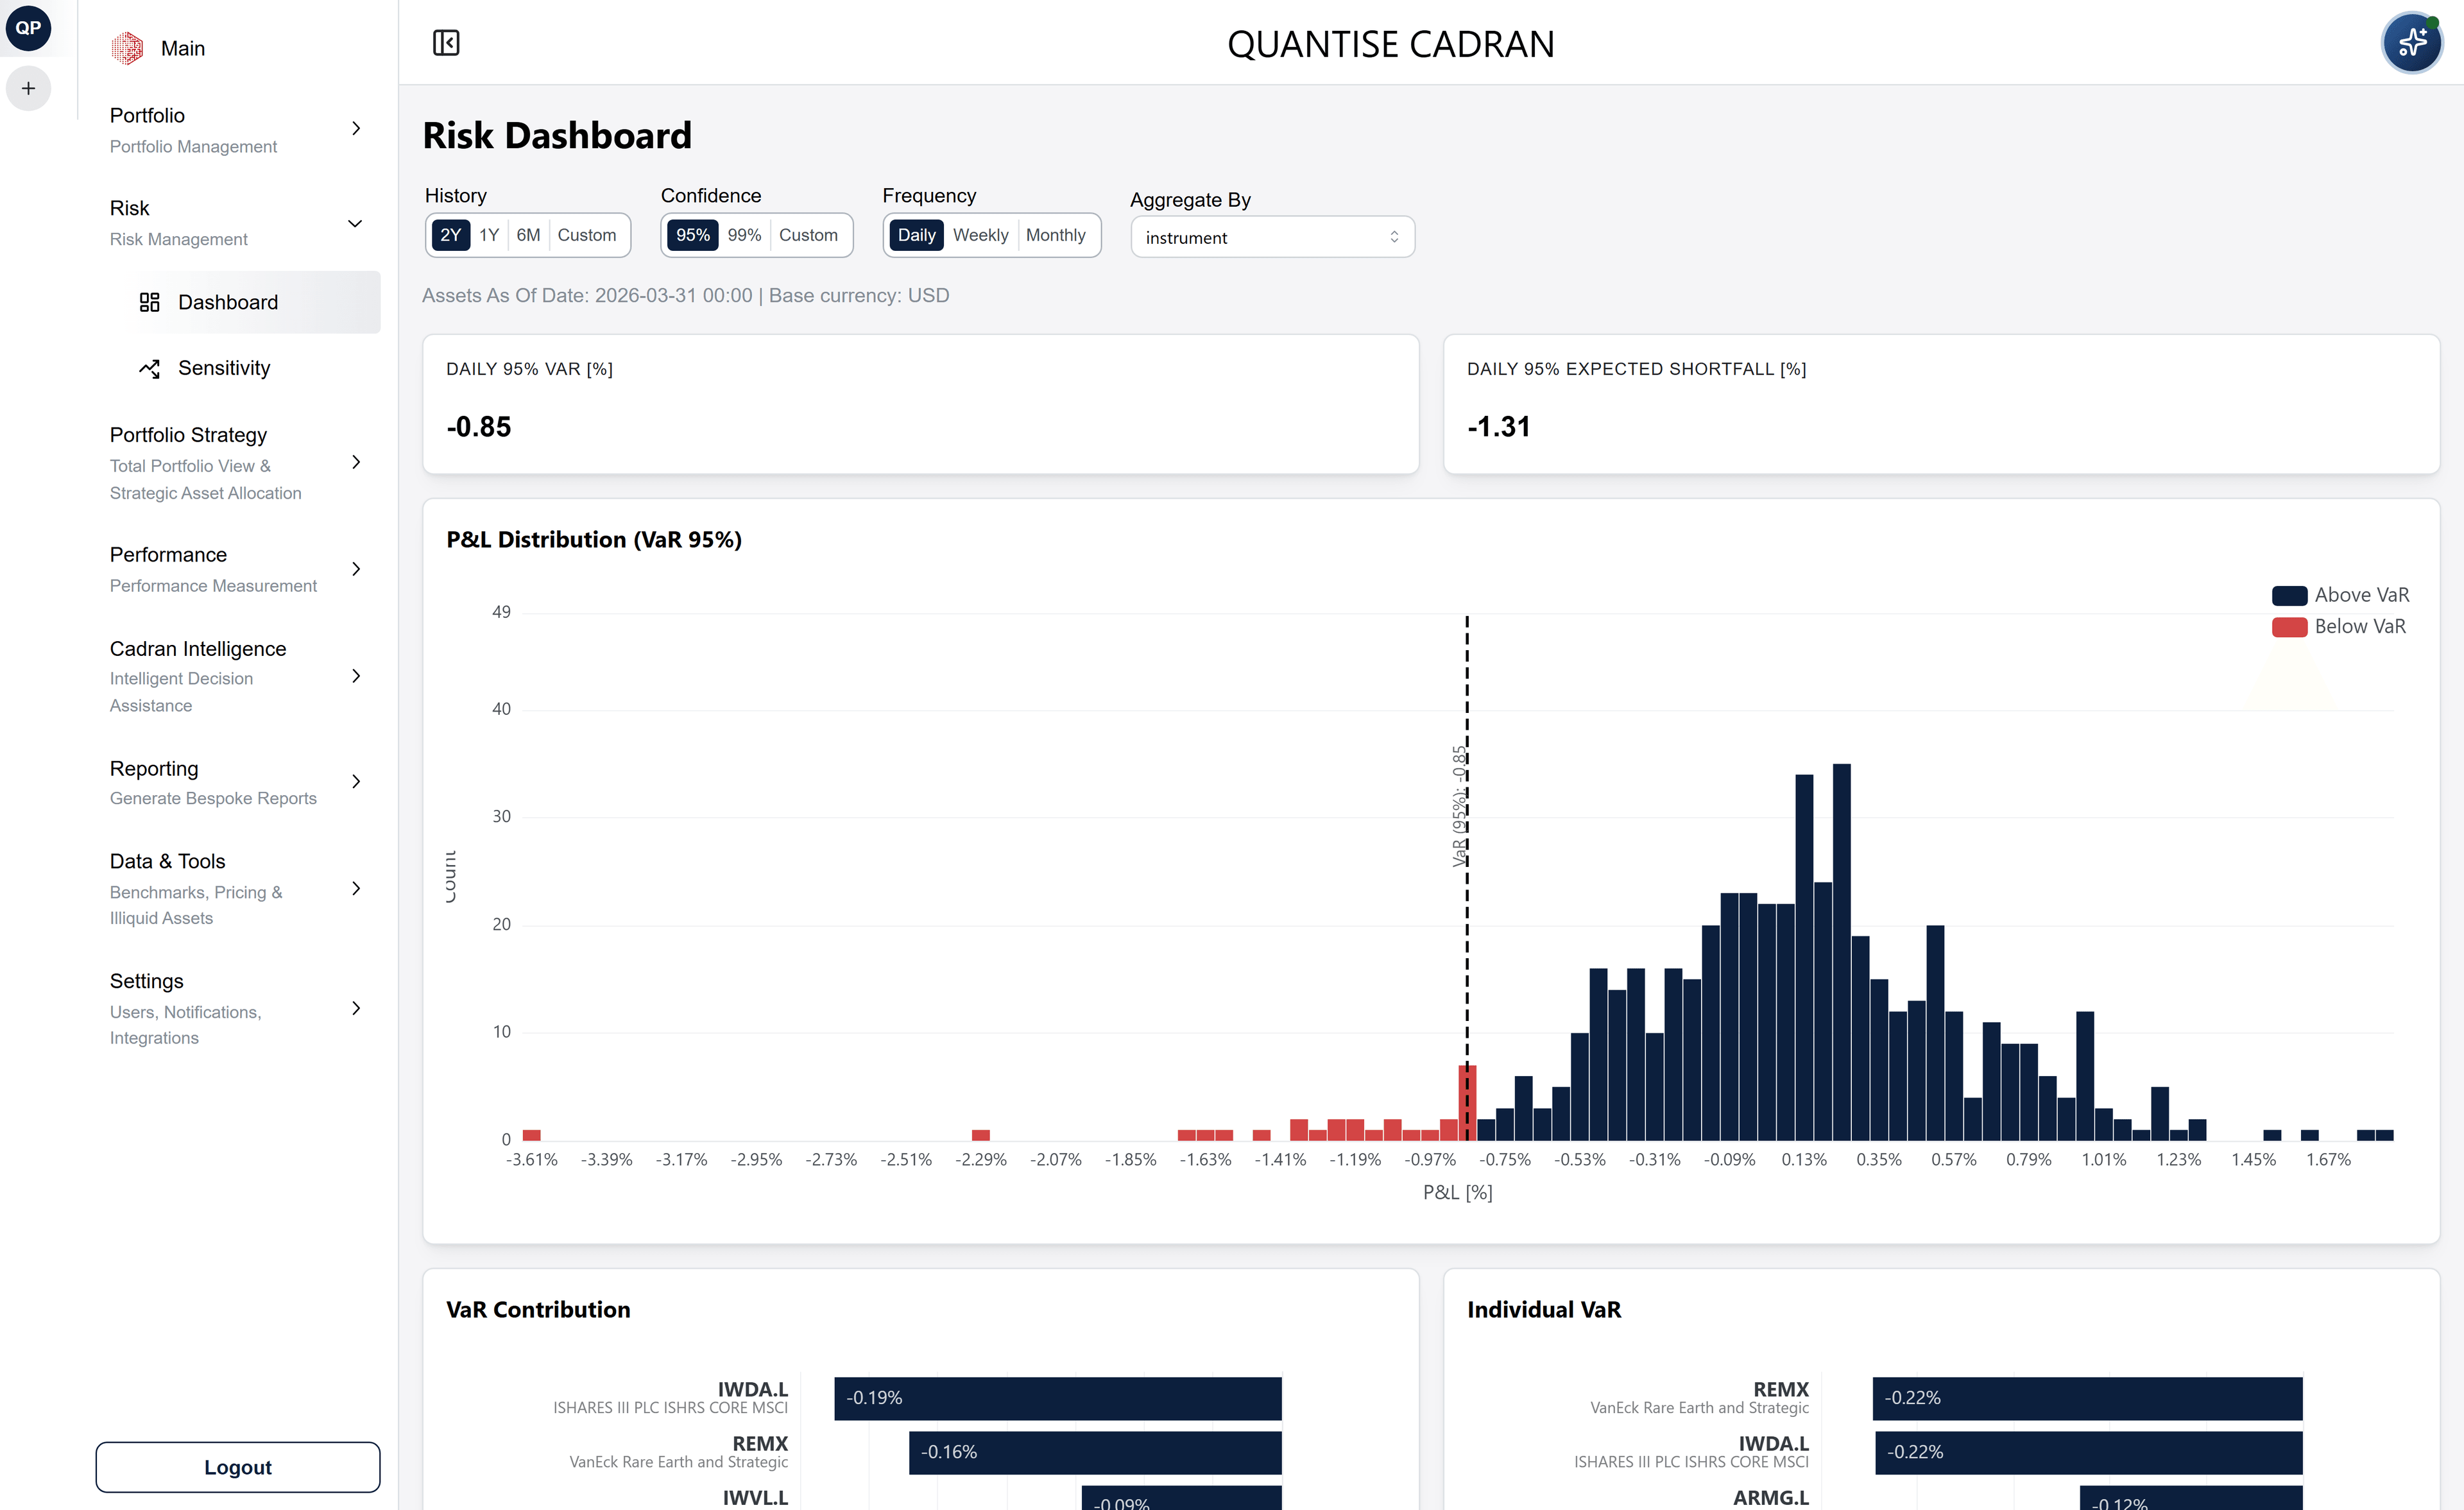
Risk Dashboard
Risk to an institutional standard. Value at Risk and Expected Shortfall at 95% and 99% confidence, decomposed to the individual instrument, with the full P&L distribution behind them.
- VaR & Expected Shortfall, 95% / 99% confidence
- Decomposed to the individual instrument
- Risk contribution by position
- P&L distribution visualisation
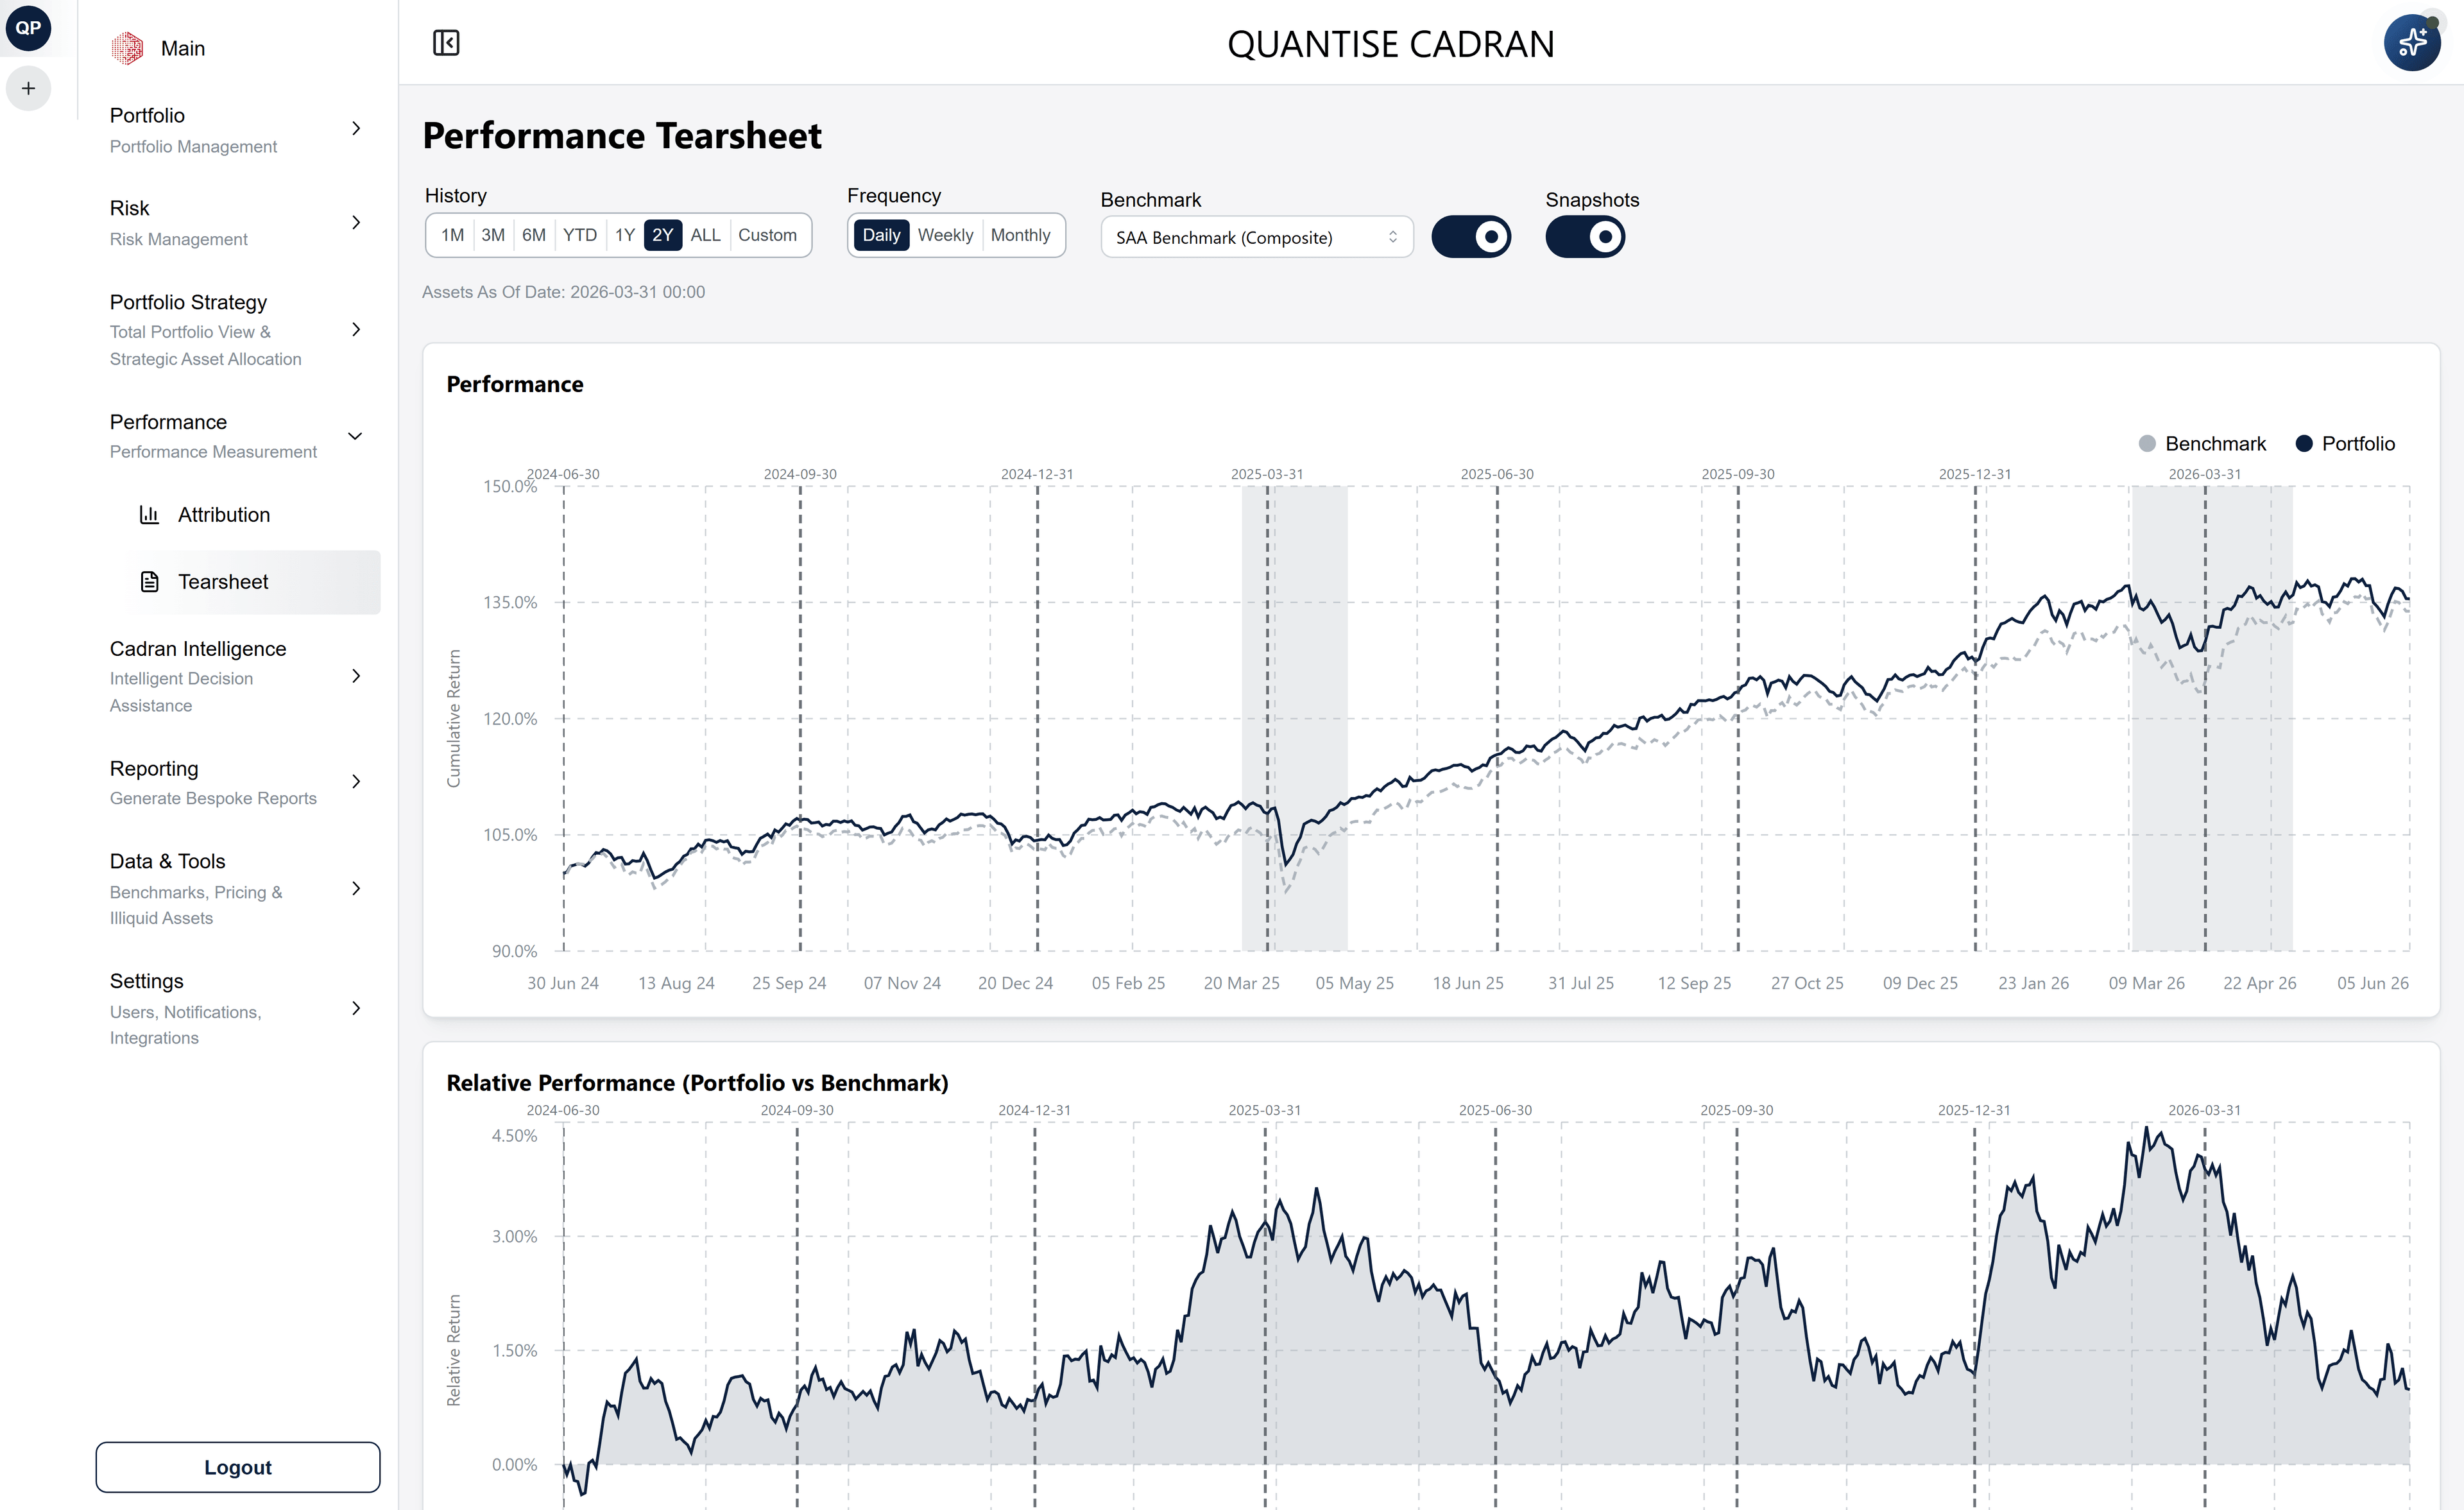
Performance Tearsheet
Track the portfolio against its benchmark over time, with cumulative and relative returns alongside 20+ performance measures, from daily to monthly views.
- Cumulative return tracking
- Relative performance versus benchmark
- 20+ performance measures
- Daily, weekly and monthly views
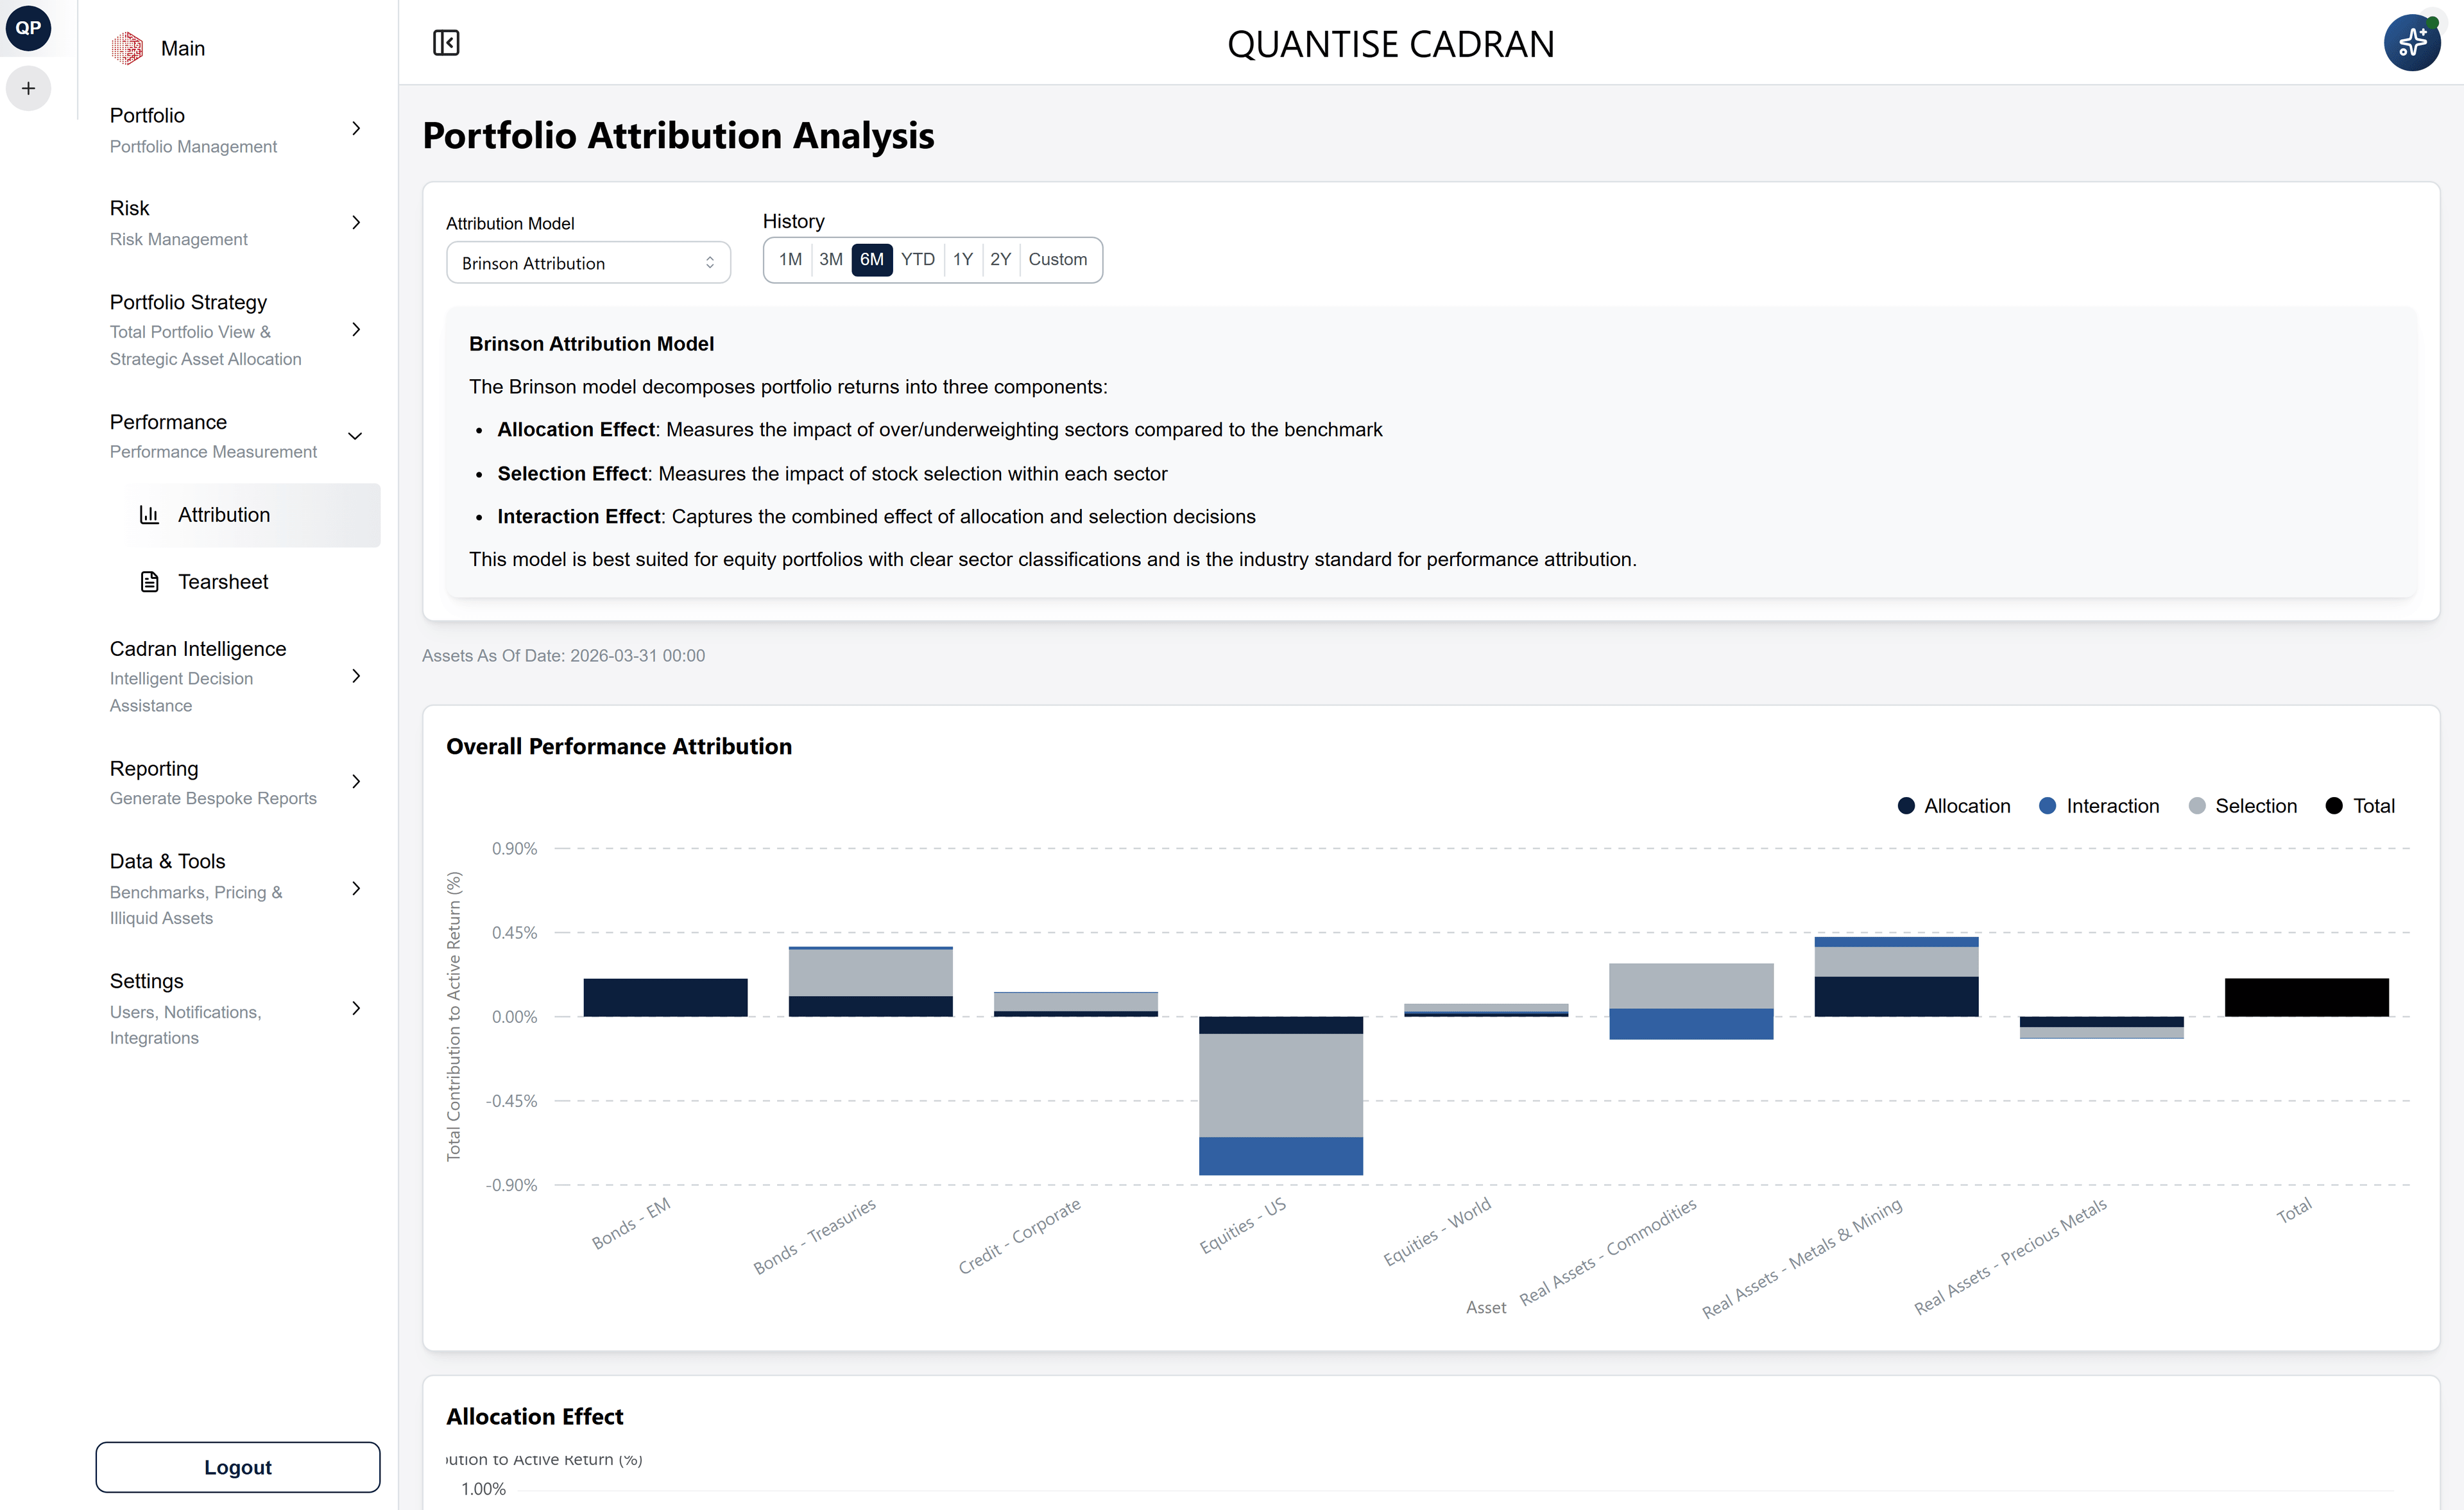
Performance Attribution
The Brinson–Fachler model decomposes active return into the decisions that produced it, separating allocation, selection and interaction effects. It needs only weights and returns per segment, so it applies across the entire portfolio.
- Allocation effect: sub-asset-class weighting decisions
- Selection effect: security choices within each sub-asset class
- Interaction, isolated and measured
- Attribution by sub-asset class, over any window
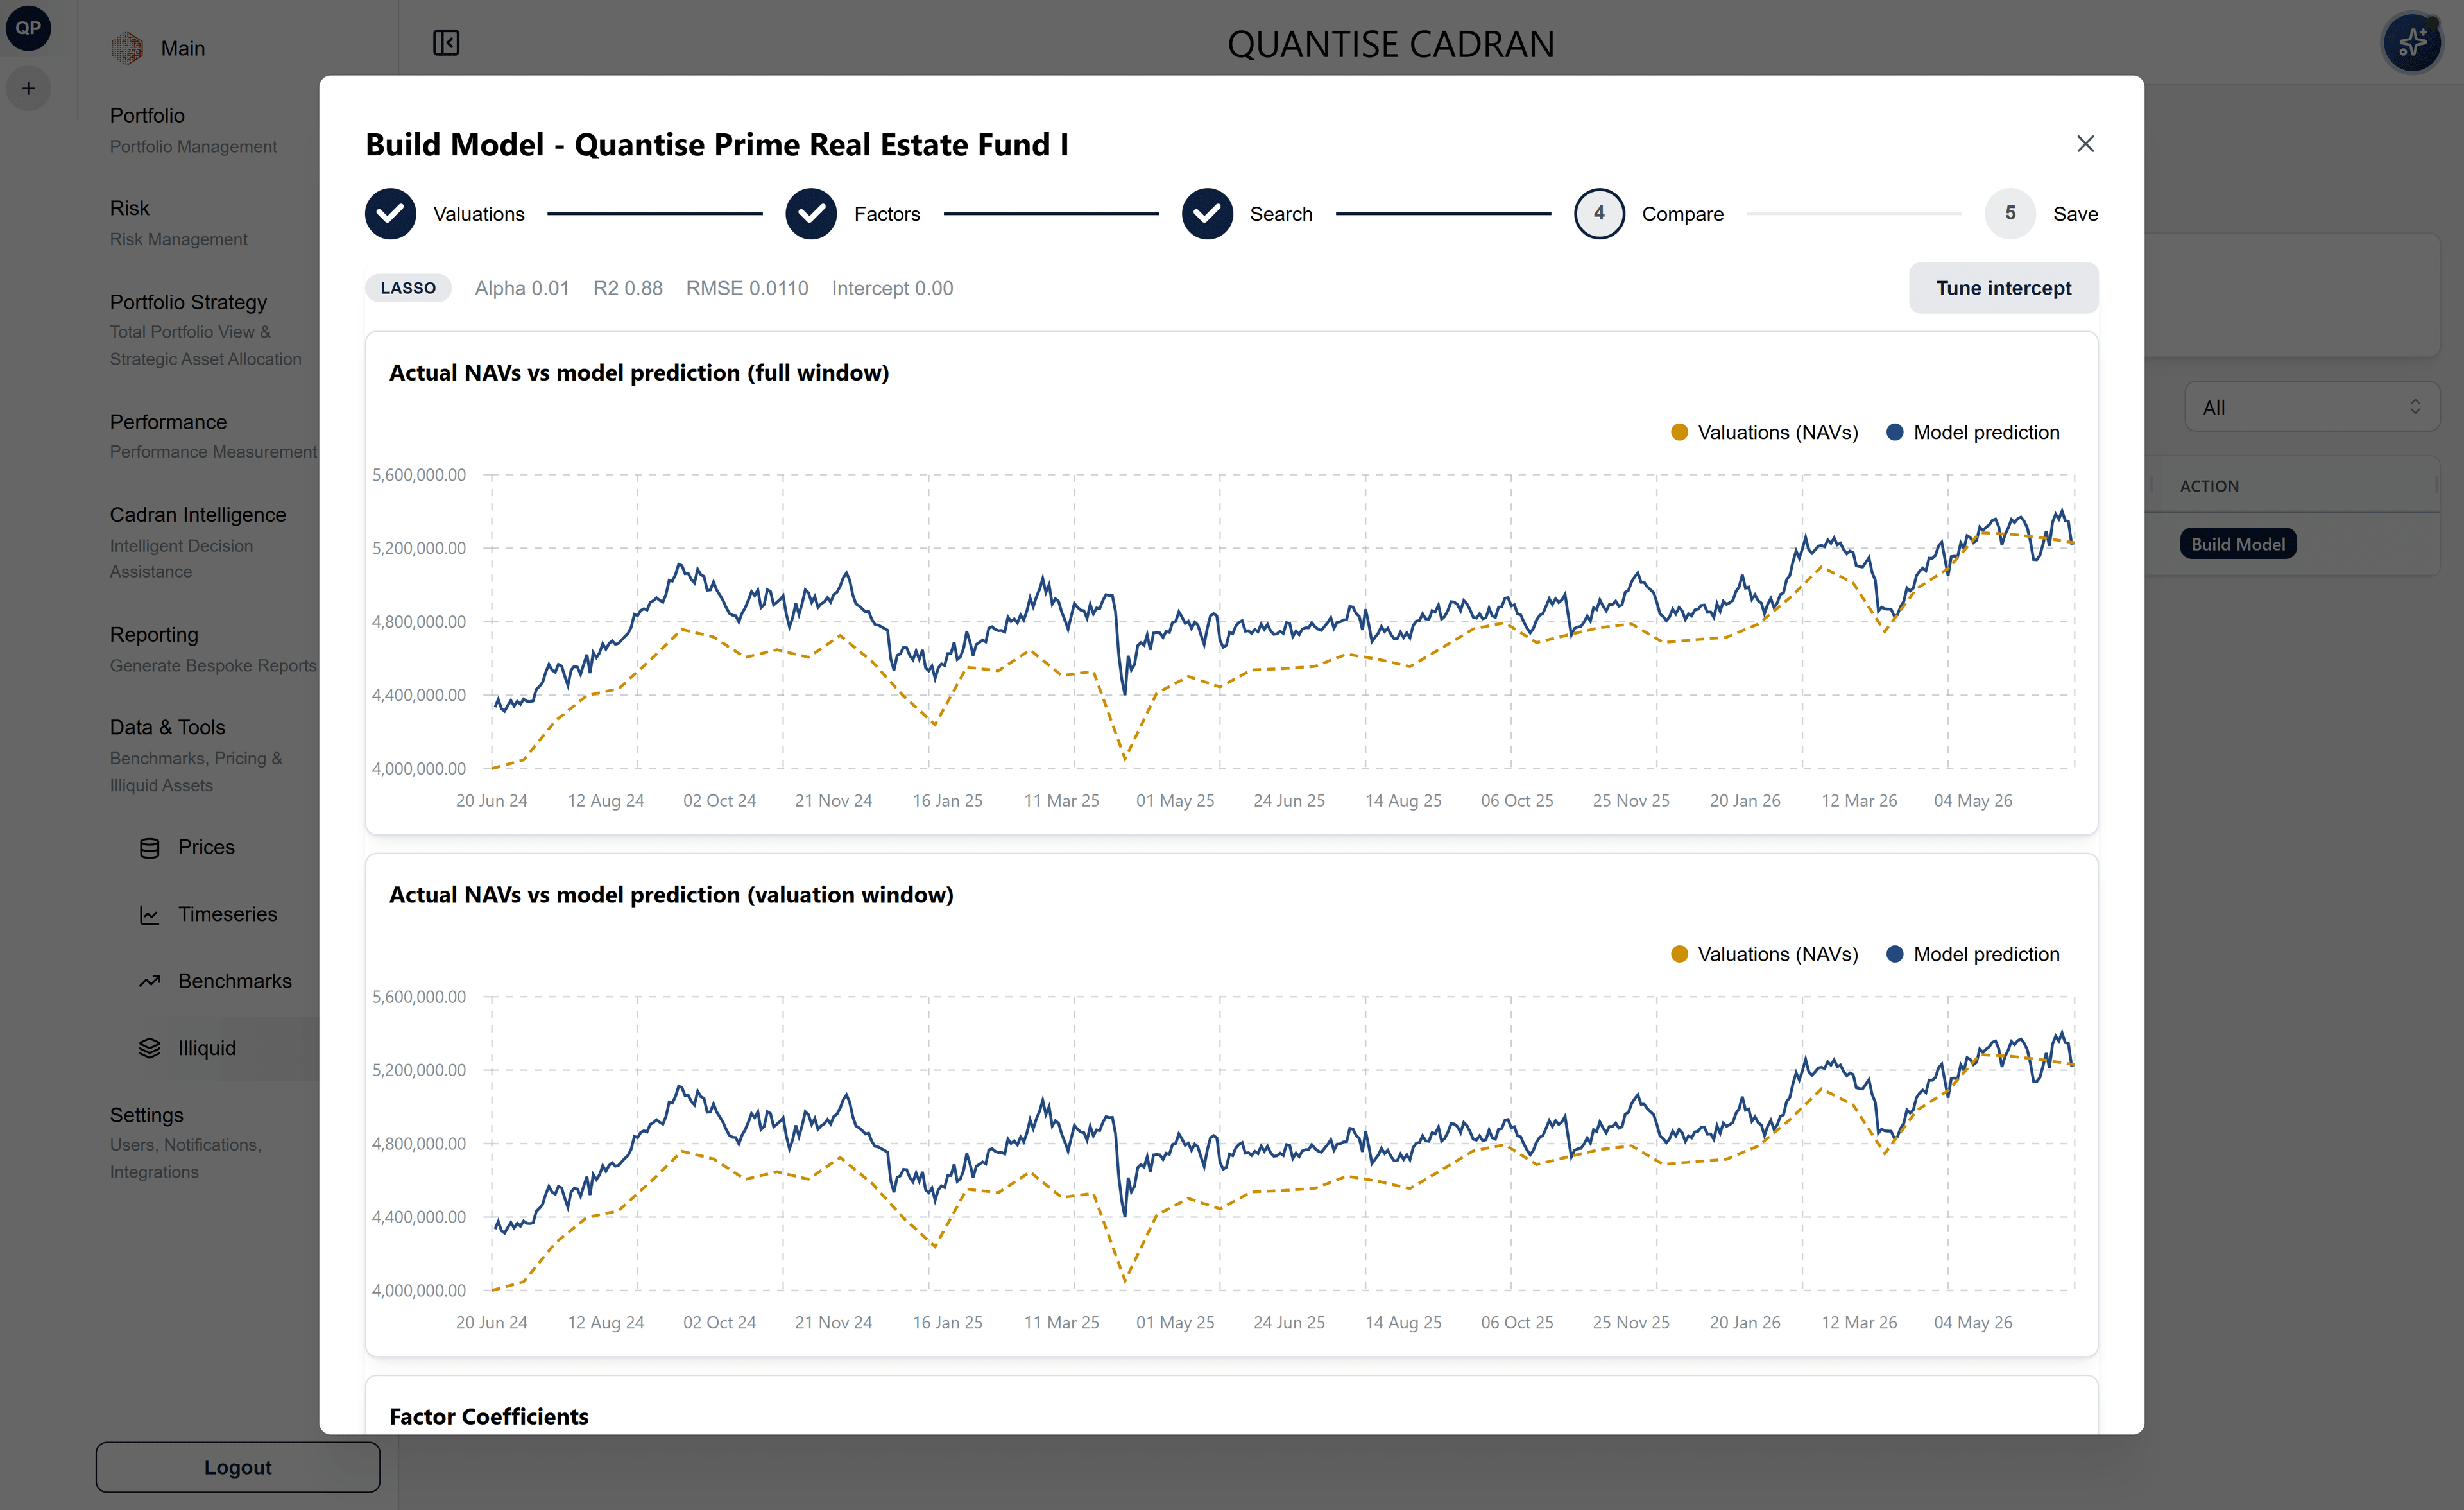
Illiquid Assets
Daily estimates for illiquid assets. Model real estate, private equity or private holdings by decomposing each into liquid factors, giving estimated daily price moves and correlations. Estimates, not marks: they are validated against actual NAVs as they arrive.
- Real estate, private equity, private business
- Factor decomposition into liquid proxies
- Estimates, not marks, labelled throughout
- Actual NAVs versus model, continuously compared
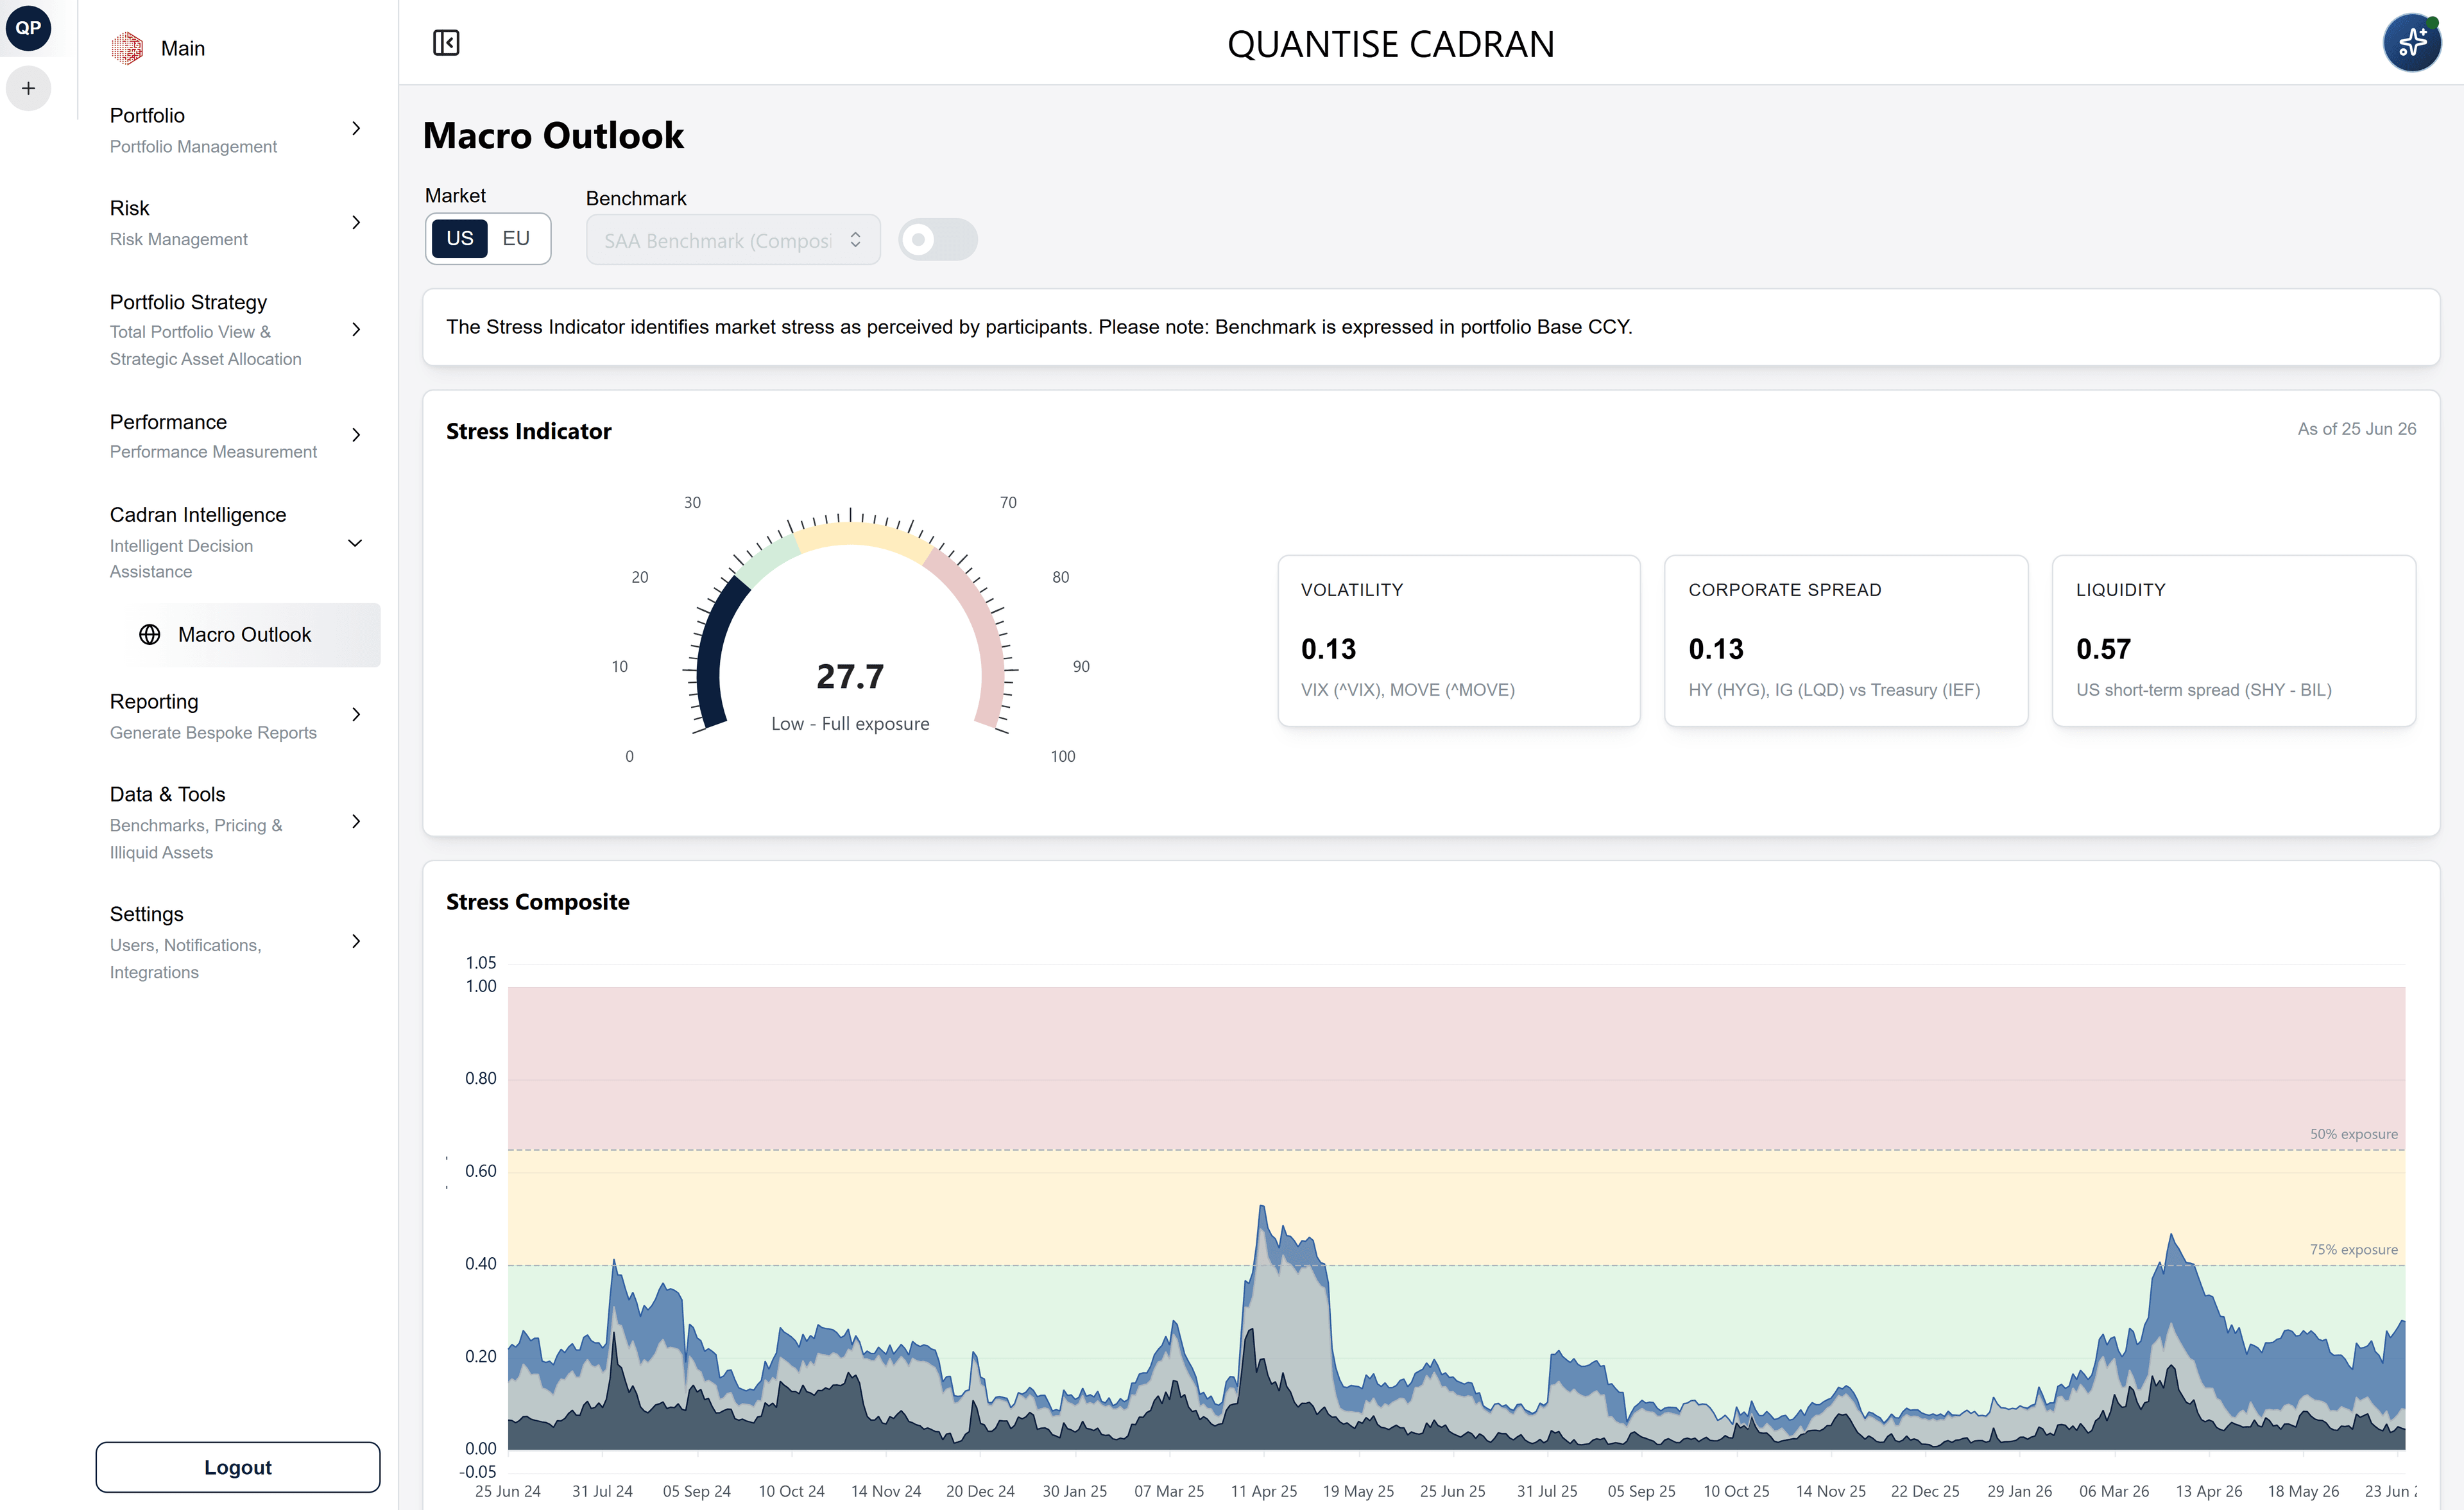
Macro Outlook
Proprietary market-stress indicators and a composite signal, with dedicated macro models for fixed-income and equity portfolios. Volatility, credit spreads and liquidity conditions, watched across global markets.
- Proprietary stress indicator & composite signal
- Dedicated fixed-income and equity models
- Corporate spread monitoring
- Liquidity condition analysis
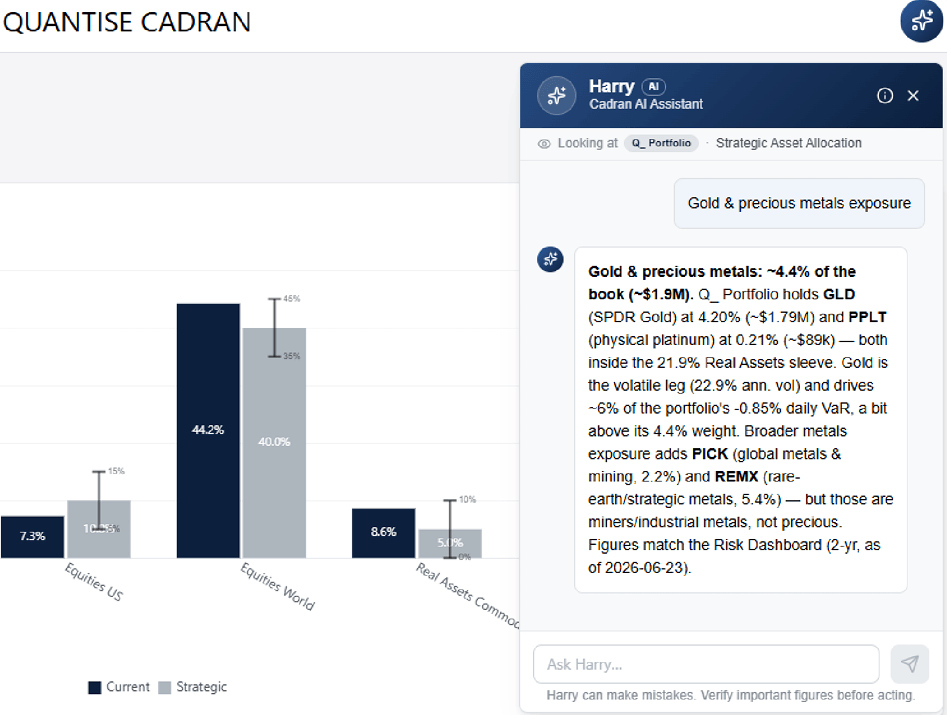
Harry
Cadran's AI assistant. Ask about risk, concentration, drift or factor exposure in plain language. Harry never invents a number. Language for the question, mathematics for the numbers.
- Plain-language questions, answered in seconds
- Risk, concentration, drift & factor exposure
- Never invents a number
- Reproducible and auditable every time
Every figure traced through the stack
A unified intelligence platform
An assistant you can question, on numbers you can trust. Every figure Harry cites is produced by Cadran's quantitative engine and traced back through the stack, auditable end to end.
- Clean, connected data across every asset class
- One quantitative engine behind every answer
- Answers in plain language, figures never invented
Report Hub
Client-ready, white-label reports. Every report is exported under your own brand, covering positioning, risk, attribution and macro, generated to your own parameters and ready for clients, committees and boards.
- Exported under your own brand
- Positioning, risk, attribution and macro
- Generated to your own parameters
- Complete audit trail and version history
Put to work for you.
Every module has a short read behind it: the method, the mathematics that produce the numbers and what each one changes in practice.
Total Portfolio View
One risk language across the whole book, with every holding judged by its contribution to total risk.
Strategic Asset Allocation
The allocation you hold set against the one you agreed, with drift reported by asset class as it develops.
Allocation & Rebalancing
Exposure read at a glance, then a two-step draft and confirm flow that reports its risk impact before anything moves.
Risk Dashboard
Value at Risk and Expected Shortfall at 95% and 99% confidence, decomposed to the individual instrument.
Performance Tearsheet
The record against the benchmark, with cumulative and relative returns and 20+ performance measures behind them.
Performance Attribution
See which decisions earned the return and which merely added risk, cleanly separated.
Illiquid Assets
Real estate and private equity decomposed into liquid factors for daily estimates, with the limits of the method stated alongside.
Macro Outlook
Proprietary stress indicators and a composite signal, watched across global markets every day.
Harry
The architecture that lets AI answer in plain language while mathematics produces every number.
Report Hub
Positioning, risk, attribution and macro, generated to your own parameters and exported under your own brand.
Allocation, risk, performance, intelligence, reporting.
From the strategic anchor through to the client report, every module reads the same book and runs on the same quantitative engine, with the method behind each figure stated alongside it.
Whole-book risk
Total Portfolio View looks through asset-class silos to the factors driving the book, orthogonalised so each unit of risk counts once, with contribution to total risk reported per holding.
Strategy and allocation
Strategic Asset Allocation holds the long-term anchor and reports drift by asset class. Allocation & Rebalancing shows exposure, then drafts and confirms the change.
Risk measurement
Risk Dashboard reports Value at Risk and Expected Shortfall at 95% and 99% confidence, decomposed to the individual instrument, with the full P&L distribution behind them.
Performance measurement
Performance Tearsheet tracks the record against the benchmark across 20+ measures. Performance Attribution separates allocation, selection and interaction effects.
Market intelligence
Illiquid Assets decomposes real estate and private equity into liquid factors for daily estimates, validated against actual NAVs. Macro Outlook watches volatility, credit spreads and liquidity conditions.
Answers and reporting
Harry answers on risk, concentration and drift in plain language and never invents a number. Report Hub exports the result under your own brand.
Ready to transform your portfolio management?
Put institutional-grade risk management and portfolio analytics behind every decision.