The record, on one page.
A return means little on its own. The tearsheet sets it against the benchmark over the same period, with the measures behind it alongside.
Cumulative returnRelative to benchmark20+ measures
One record, at the resolution the question needs.
A return quoted on its own invites the wrong conversation. It becomes meaningful only when it is set against what the benchmark did over the same period, and against the measures that describe how it was earned.
The tearsheet is the standing record of that comparison. Cumulative return over time, relative performance against the benchmark, and more than twenty performance measures beside them, so one page carries the headline result and the detail that qualifies it.
The same record can be read at different resolutions, from daily through weekly to monthly, which lets a long-run picture and a recent one be taken from the same place. The figures are the ones the platform computes everywhere else, so the tearsheet agrees with the dashboards it sits beside.
What the tearsheet holds
Cumulative return
The portfolio's return tracked over time, from the start of the window you choose through to its end.
Relative to benchmark
The same period read against the benchmark, so performance is reported as a comparison rather than a bare number.
20+ measures
More than twenty performance measures alongside the curves, available in daily, weekly and monthly views.
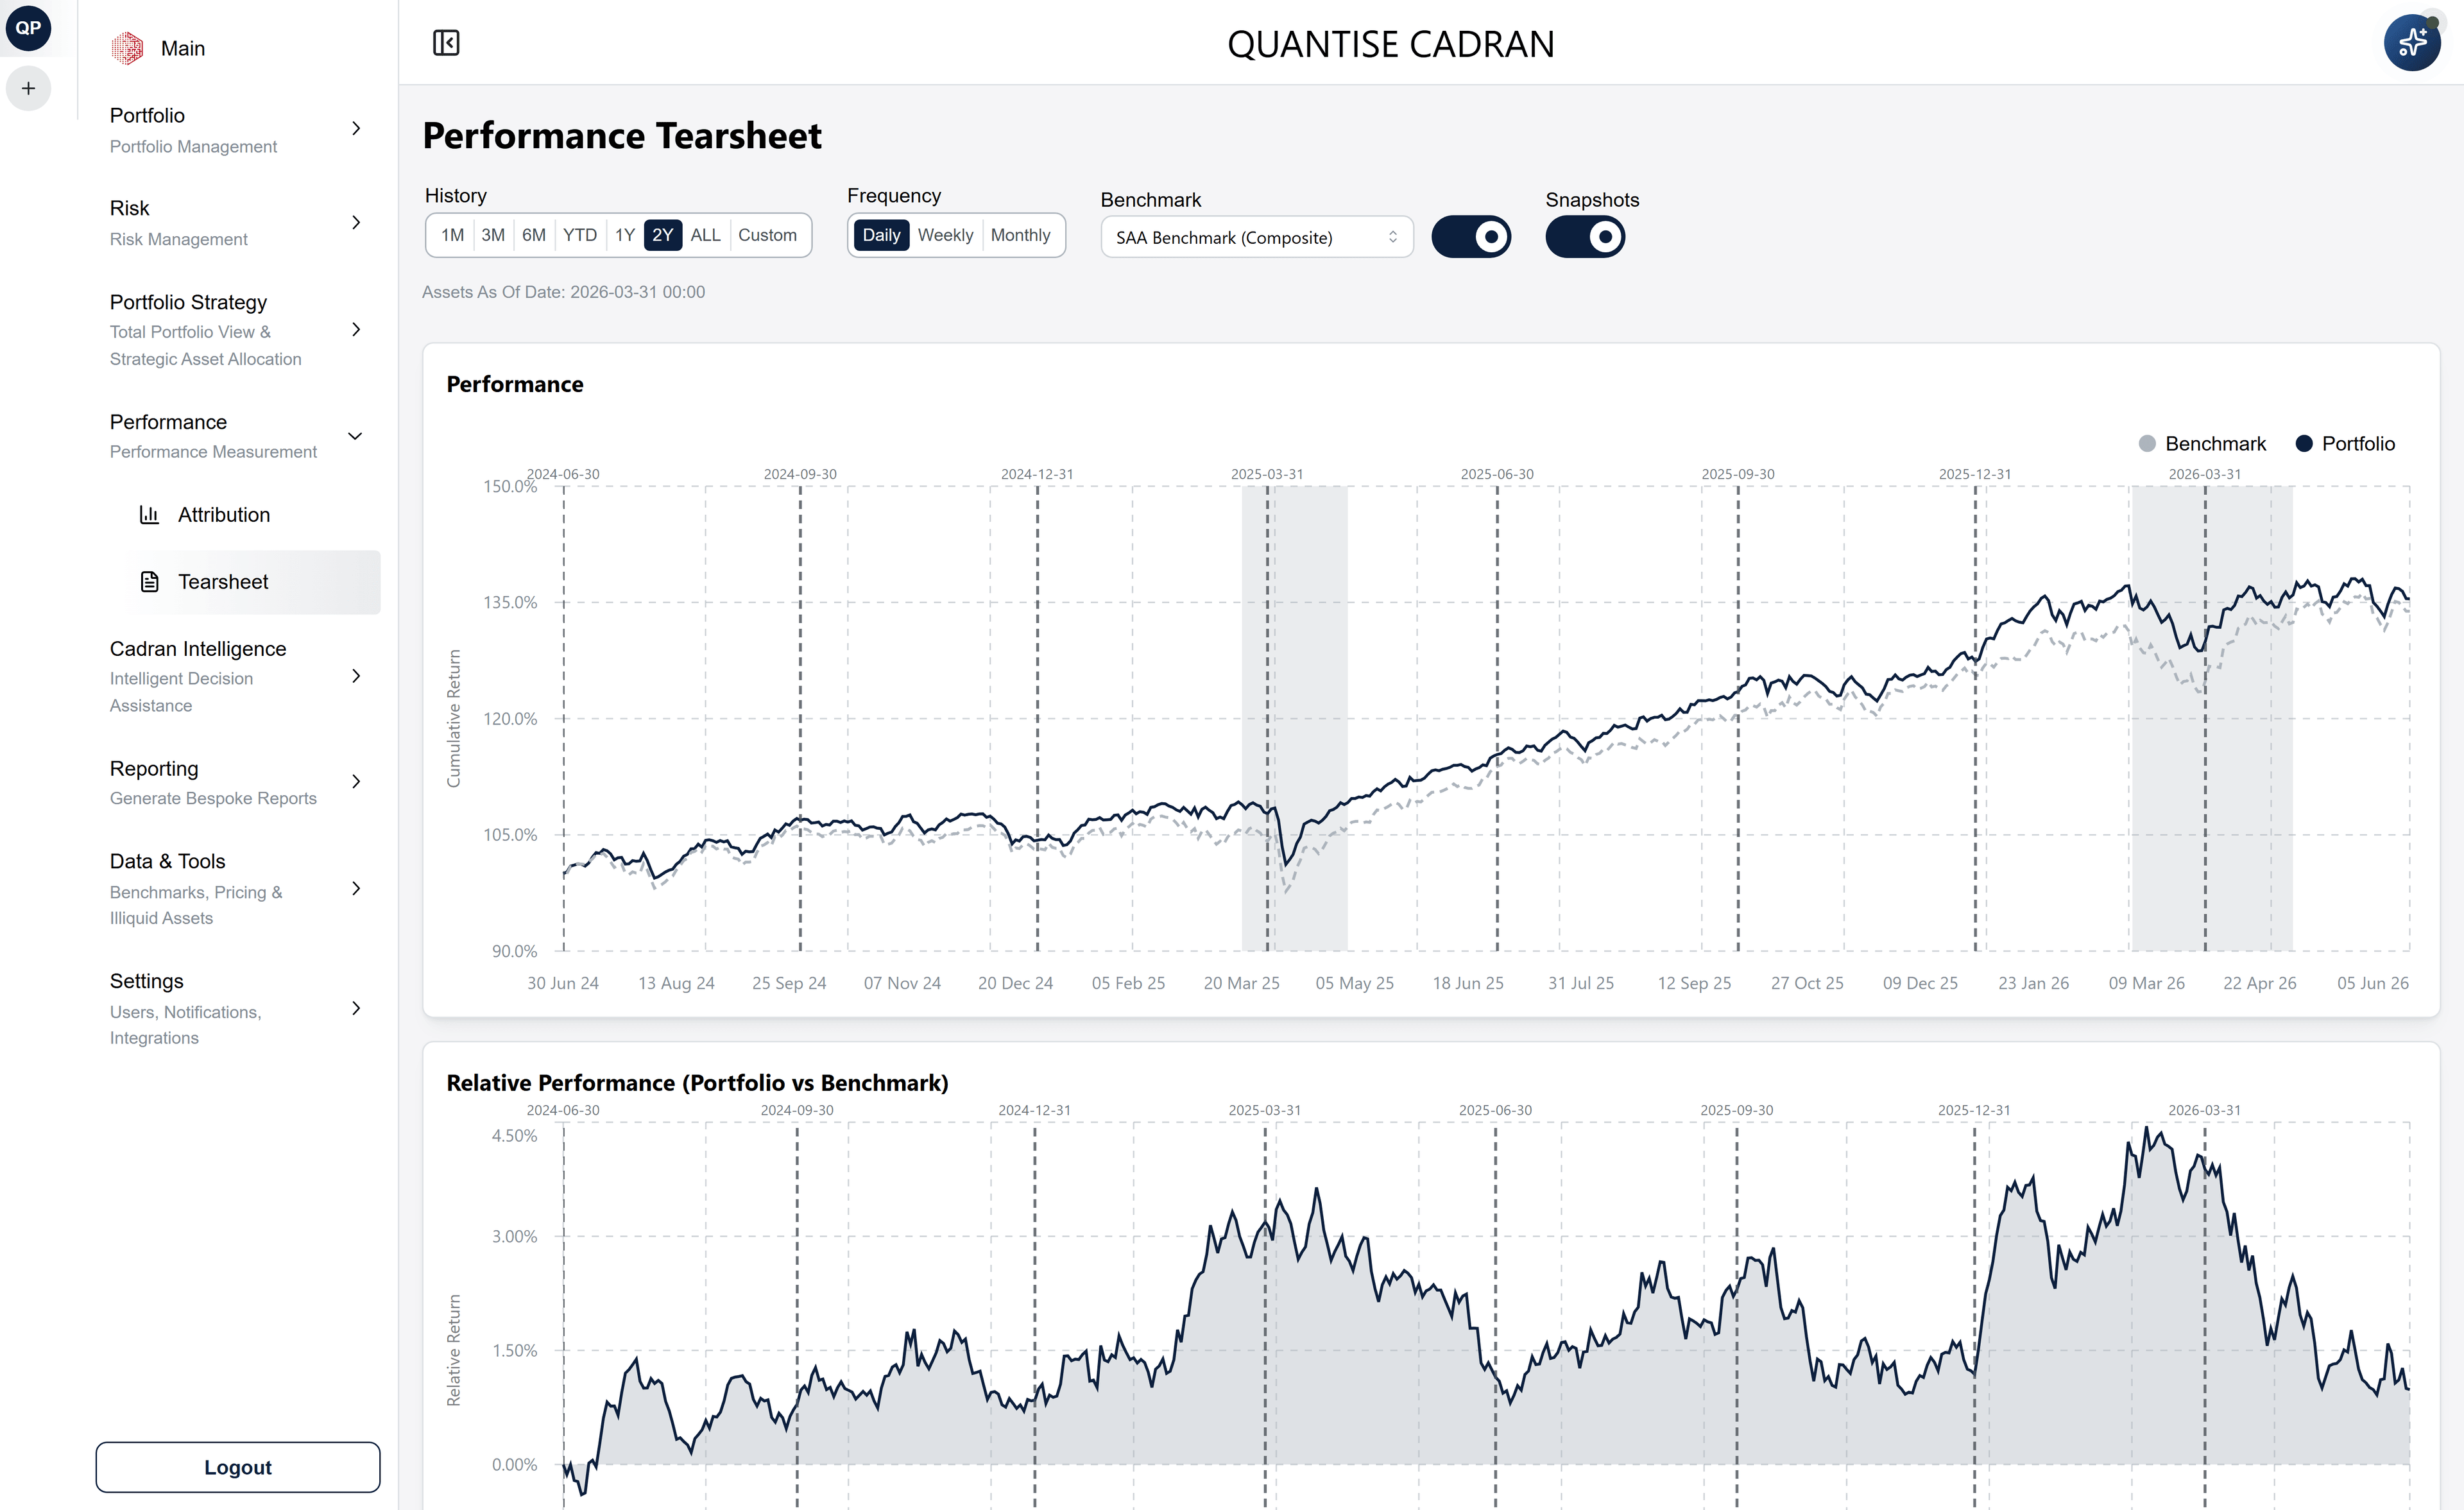
Illustrative data: synthetic portfolio, not a client book.
Keep the whole record in one place.
The tearsheet runs in Cadran across daily, weekly and monthly views, beside the benchmark the portfolio is measured against.