Balance risk, not just capital.
A 60/40 portfolio holds 60% of its capital, but almost all of its risk, in equities. The Total Portfolio View looks through asset-class silos and shows what truly drives your portfolio, live.
Factor modelResidual riskTwo lenses
60% of the capital, ≈ 90% of the risk.
Most portfolios are described by where the capital sits: so much in equities, so much in bonds, a sleeve of real assets. It is a natural way to buy a portfolio, but a poor way to understand one. Capital weights say what you own. They say very little about what can hurt you.
Risk does not respect asset-class borders. Equities are several times more volatile than high-grade bonds, so a portfolio that looks balanced on paper concentrates almost all of its risk in a single driver. When that driver turns, diversification that existed only in the capital table disappears exactly when it is needed.
The Total Portfolio View inverts the perspective. Every holding, liquid or illiquid and in any sleeve, is judged on a single criterion: its contribution to the risk and return of the whole book. Capital allocation becomes an unbiased contest instead of a set of walls between sleeves.
Importantly, none of this replaces your allocation process. The Total Portfolio View works as an addition to SAA and TAA. The strategic allocation remains the anchor the view is measured against, tactical views keep their role, and the view adds one consistent risk language across both, so every decision can be read in the same terms.
Two views of one book
How the view is built
Factor model
Each holding is regressed on a shared set of market factors built from liquid proxies, such as equities, rates, credit, currencies and commodities.
Residual risk
What the factors don't explain is reported honestly as idiosyncratic risk, position by position.
Two lenses
See exposure as Positioning, how the book moves when a factor moves and the number you size a hedge with. Or as vs SAA, the same exposure read as a tilt away from your policy allocation.
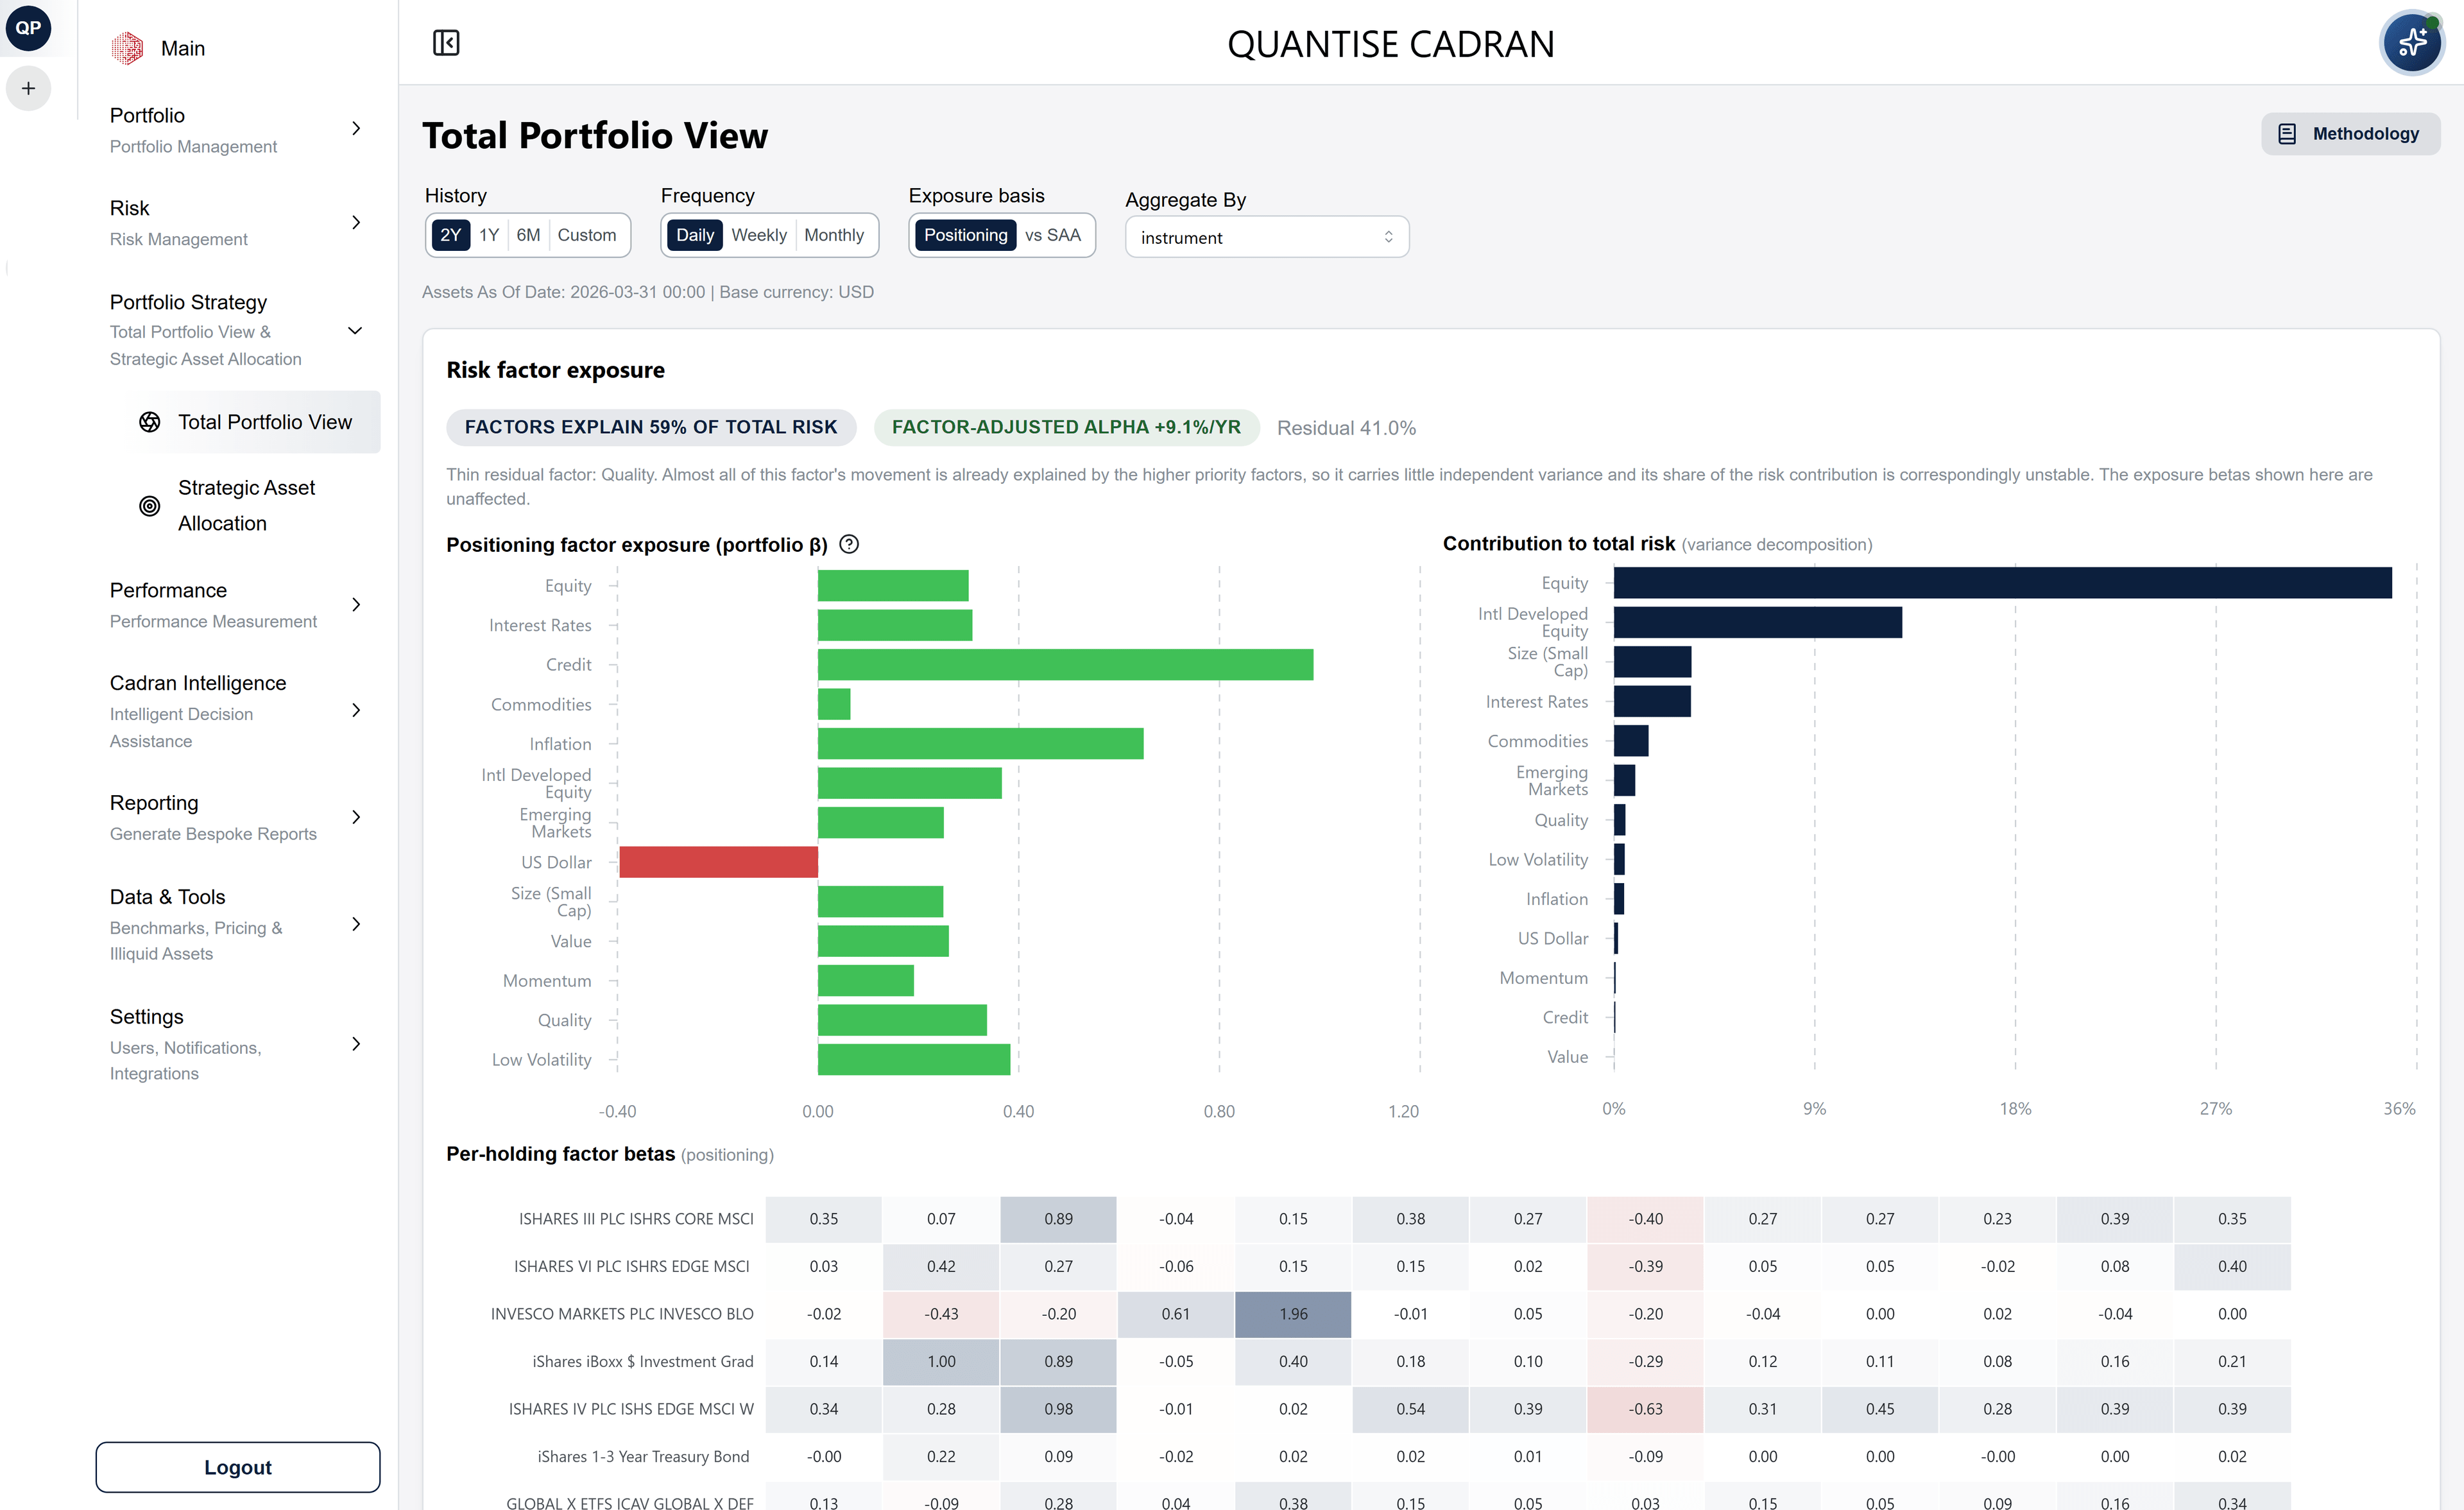
The Total Portfolio View in Cadran · factor exposure, contribution to total risk, per-holding betas
See what truly drives your portfolio.
The Total Portfolio View is live in Cadran for every portfolio, across liquid and illiquid holdings.