Risk, down to the instrument.
A portfolio-level risk number tells you how much is at stake. It does not tell you where it sits. The Risk Dashboard reports both.
VaR & Expected ShortfallDecomposed to the instrumentThe full distribution
Schematic · a P&L distribution and its loss tail
The threshold: the loss a portfolio is not expected to exceed at a given confidence level, over a given horizon.
Beyond the threshold: the average loss across the cases in which that threshold is exceeded.
A single headline risk figure is convenient and, on its own, close to useless. It says how much is at stake without saying which positions put it there, and a number nobody can trace back to a holding is a number nobody can act on.
Cadran reports Value at Risk and Expected Shortfall together, at 95% and 99% confidence, so the threshold and the tail beyond it are read side by side rather than one standing in for the other. Two measures at two confidence levels describe the shape of the downside far better than any one of them alone.
Both are then decomposed to the individual instrument, with risk contribution reported position by position, which is what turns a portfolio-level measurement into something you can do something about. Behind them sits the full P&L distribution, so the headline figures are read as points on a distribution you can see, not as verdicts arriving on their own.
What the dashboard reports
VaR & Expected Shortfall
Both measures reported at 95% and 99% confidence, so the threshold and the tail beyond it are read together.
Decomposed to the instrument
The portfolio figure breaks down to the individual instrument, with risk contribution reported position by position.
The full distribution
The P&L distribution behind the headline numbers is shown in full, not only the two points taken from it.
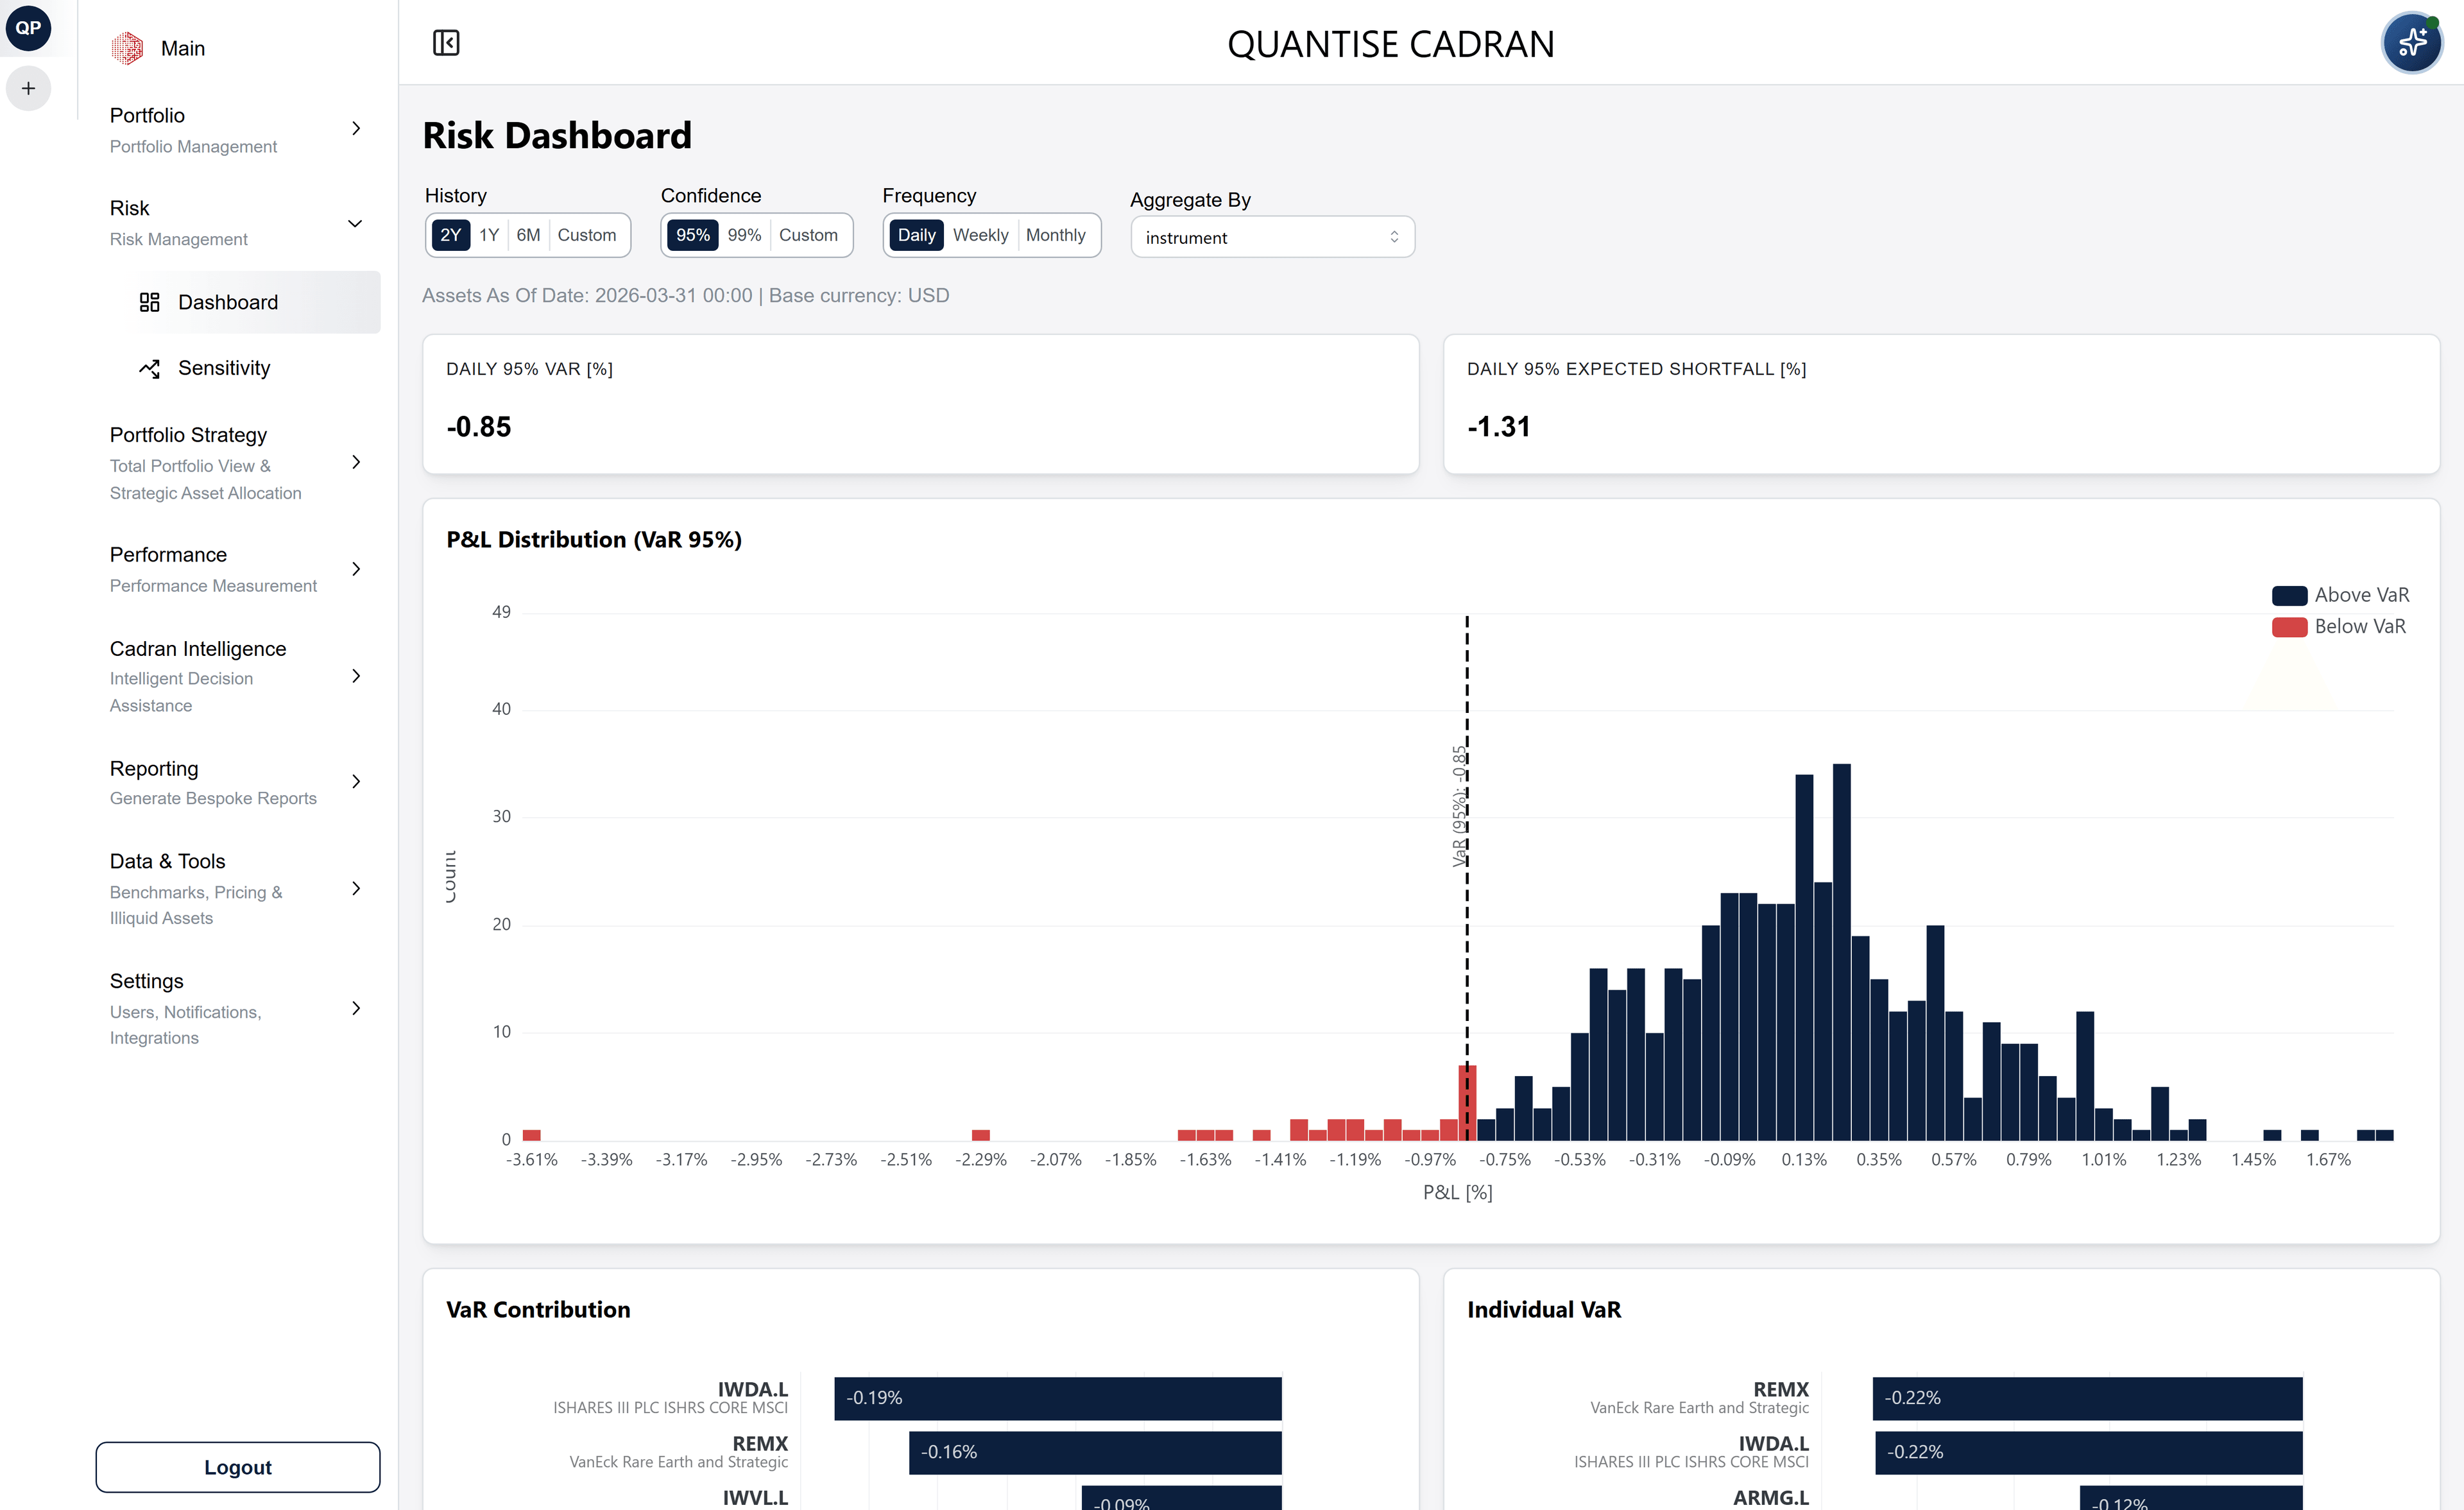
Illustrative data: synthetic portfolio, not a client book.
See where the risk actually sits.
Value at Risk and Expected Shortfall run in Cadran at 95% and 99% confidence, decomposed to the individual instrument.